Download
1 / 39
390 likes | 563 Views
A Generalized Model for Financial Time Series Representation and Prediction. Author: Depei Bao Presenter: Liao Shu Acknowledgement: Some figures in this presentation are obtained from the paper. Outline of the Presentation. Introduction

E N D
A Generalized Model for Financial Time Series Representation and Prediction Author: Depei Bao Presenter: Liao Shu Acknowledgement: Some figures in this presentation are obtained from the paper
Outline of the Presentation • Introduction • Critical Point Model (CPM) for Financial Time Series Representation • Motivation and importance of using critical points • The generalized CPM to represent financial time series • Probabilistic model based on CPM for prediction • Experimental Results • Conclusion
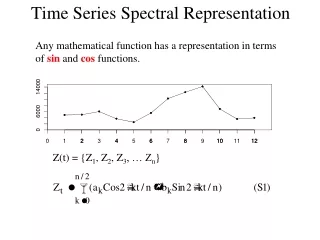
Introduction • Flow Chart of the General Financial Time Series Prediction Method: Input Data Feature Extraction Probabilistic Model Optimization Forecast Value
Introduction • Main Idea of the Proposed Method: Stock movements are affected by two types of factors • Gradual strength changes between the buying side and the selling side (Useful Information) • Random factors such as emergent affairs or daily operation variations (Noise) • Motivation and Goal of the Proposed Method: • Using the original raw price data to do prediction can be problematic • Remove the noise information and preserve the useful information to do the prediction
Critical Point Model (CPM) for Financial Time Series Representation • Motivation (Why critical point model?) A fluctuant financial time series consists of a sequence of local maximal/minimal points. Some of them mirrors the information of trend reversals
Motivation and Importance of using Critical Points: Pattern Information • Based on the critical points, the input financial time series can be represented in a pattern-wised manner to reflect their trends over different periods
CPM Based Representation • A financial time series is comprised of a sequence of critical points (local minimal/maximal) • We only consider the critical points • Only some of the critical points are preserved (remove those critical points which are considered as noise factors)
Definition of Noise • Defined based on two measure criterions • Amount of oscillation between two critical points • Duration between two critical points • A small oscillation and a short duration will be regarded as noise.
Simple CPM • Example Define a minimal time interval T (duration) and a minimal vibration percentage P (oscillation). Remove the critical points (X(i),Y(i)) and (X(i+1),Y(i+1)) if:
Drawbacks of the Simple CPM • The Simple CPM is too rough, the critical points are accessed in a local range (without looking ahead) • Example of an exception: In this example, it is assume that AB, AD and BE don’t satisfy the removing criteria of the simple CPM, but BC, CD, DE satisfy
Drawbacks of the Simple CPM • Another exception case: In this example, BC is assumed to be satisfy the removing criteria of simple CPM
Drawbacks of the Simple CPM • Root of the drawback of simple CPM: • Only testing the distance between two successive critical points to evaluate a vibration • The generalized CPM (GCPM) is proposed in this paper to overcome these shortcomings
The Generalized CPM • The time series is processed sequentially in the unit of three points (two minimal points and one maximal point) • Important Reminder: in GCPM, the three points in a unit are not necessary to be successive critical points
The Generalized CPM • Main issues of GCPM: • How to choose the next three-point unit to be processed • How to choose preserved critical points
Initialization of GCPM • All the local maximal/minimal points in a raw time series are extracted to form the initial critical point series:
Data Representation of GCPM • After constructing the initial critical point series C, a critical point selection criteria is applied to filter out the critical points corresponding to noise. Then the original time series is approximated by linear interpolating points between a maximal point and a minimal point
The Critical Point Selection Criteria of GCPM • The first and the last data point in the original time series are preserved as the first and last point in C • Local maximal and local minimal points in the approximated series must appear alternately
The Critical Point Selection Criteria of GCPM • Selection is also based on the oscillation threshold P and the duration threshold T • Consider P first, there are four cases • Both the rise and the decline oscillations exceed P • The rise over P, but the decline below P • The decline over P, but the rise below P • Neither the rise nor the decline over P.
Second Layer Checking with Duration T • For the oscillation below P but the duration above T, it still holds valuable trend information • Case 2 and Case 3 pass the duration T checking will be considered as Case 1 • For Case 4, if any side pass the duration T checking, the midpoint will be removed and choose the next test unit beginning with the current third point
Process for Case 1 • The first two points, i, i+1 will be preserved, and then the next unit will be i+2,i+3,i+4
Process for Case 2 • Two sub-cases • If Y(i+3) >= Y(i+1), the next unit will be i, i+3, i+4 • Otherwise, the next unit will be i, i+1, i+4
Process for Case 3 • Two sub-cases • Y(i+3)>=Y(i+1) • Y(i+3)<Y(i+1) • The next unit will always be i+2,i+3,i+4 because Y(i+2)<=Y(i)
Process for Case 4 • Two sub-cases • Y(i)<=Y(i+2): next unit will be i, i+3, i+4 • Y(i)>Y(i+2): next unit will be i+2, i+3, i+4
Price Pattern Matching in GCPM • Two types of patterns: • The point-wise patterns • The trend pattern
Price Pattern Matching in GCPM • An example of finding a constraint H & S pattern
Price Pattern Matching in GCPM • Numerical formulation of the constraint H & S pattern
Probabilistic model based on GCPM for prediction • After the data smoothing and GCPM process, five common technical analysis systems including 30 technical indicators are used to represent the each turning point. • Price pattern system • Trendline system • Moving average system • RSI oscillator system • Stochastic SlowK-SlowD oscillator system • The turning points and their technical indicators are used as training examples to learn the parameters of a probabilistic model based on the Markov Network
Probabilistic model based on GCPM for prediction • The Markov Network • Y = {true,false} represent whether a critical point is the real turning point • X = {X1,X2,…,Xn}, Xi = {true,false} is a vector with Xi represents the i-th technical indicator and TRUE for the occurrence of the signal for the current critical point
Probabilistic model based on GCPM for prediction • The Markov Network Can be Converted to: • For each indicator, if the corresponding rule Xi -> Y (~Xi V Y) is true, then fi(xi,y) = 1, otherwise fi(xi,y) = 0. The to-be-estimated parameter wi corresponds to each rule.
Optimization of Parameters • The parameter wi of the probabilistic model is learned by optimizing the conditional log-likelihood (CLL): • n is the number of training samples. • After obtaining the optimal parameters, the inference step is calculated by using the Gibbs sampling method (a special Markov Chain Monte Carlo algorithm)
Experimental Results • The approximation accuracy of GCPM, the normalized error (NE) is adopted as the metric • NE for approximating the prices of IBM
Experimental Results • Graphical comparison between the simple CPM and the proposed GCPM to model the IBM price series
Experimental Results • Test on Stock Trading: • A simple trading rule: if the current reversal is from an uptrend to a downtrend over a certain probability estimated by the proposed model, then sell, and vice versa. With initial fund $1000 • Trading log of ALCOA INC for 4 years
Experimental Results • Test the system on the CBOT Soybeans future prices from 1/5/1970 to 12/21/2006
Experimental Results • The system is also evaluated for the simulated trades on 454 stocks of the S&P 500c. Then stocks are randomly picked and examine their profits on three periods
Conclusion • This paper proposed a new financial time series representation method for prediction based on the generalized critical point model (GCPM) • The GCPM based representation is general and robust • Experimental results demonstrated that even in a period where a stock has a significant downtrend, the proposed method can still make profits.
End of My Presentation Thank you!