Download
1 / 121
1.21k likes | 1.43k Views
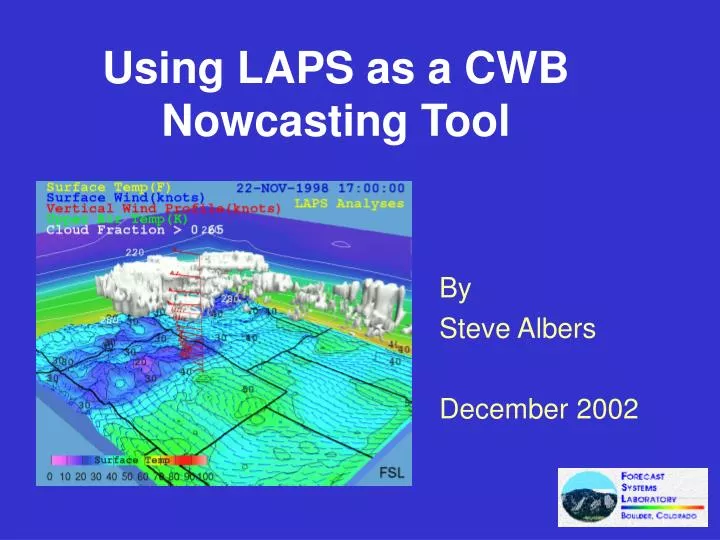
Using LAPS as a CWB Nowcasting Tool. By Steve Albers December 2002. Local Analysis and Prediction System (LAPS). A system designed to: Exploit all available data sources Create analyzed and forecast grids Build products for specific forecast applications Use advanced display technology

E N D
Using LAPS as a CWB Nowcasting Tool By Steve Albers December 2002
Local Analysis and Prediction System (LAPS) A system designed to: • Exploit all available data sources • Create analyzed and forecast grids • Build products for specific forecast applications • Use advanced display technology …All within the local weather office
CWB LAPS Grid • LAPS Analysis Grid • Hourly Time Cycle • Horizontal Resolution = 5 km • Vertical Resolution = 50 mb • Size: 199 x 247 x 21
LAPSDataSources The blue colored data are currently used in AWIPS LAPS. The other data are used in the "full-blown" LAPS and can potentially be added to AWIPS/LAPS if the data becomes available.
Multi-layered Quality Control • Gross Error Checks • RoughClimatologicalEstimates • Station Blacklist • Dynamical Models • Use of meso-beta models • Standard Deviation Check • Statistical Models (Kalman Filter) • Buddy Checking
Standard Deviation Check • Compute Standard Deviation of observations-background • Remove outliers • Now adjustable via namelist
Kalman QC Scheme FUTURE Upgrade to AWIPS/LAPS QC • Adaptable to small workstations • Accommodates models of varying complexity • Model error is a dynamic quantity within the filter, thus the scheme adjusts as model skill varies
3-D Temperature • First guess from background model • Insert RAOB, RASS, and ACARS if available • 3-Dimensional weighting used • Insert surface temperature and blend upward • depending on stability and elevation • Surface temperature analysis depends on • METARS, Buoys, and Mesonets (LDAD)
Successive correction analysis strategy • 3-D weighting • Successive correction with Barnes weighting • Distance weight e-(d/r)2 applied in 3-dimensions • Instrument error reflected in observation weight • Wo = e-(d/r)2 / erro2 • Each analysis iteration becomes the background for the next iteration • Decreasing radius of influence (r) with each iteration • Each iteration improves fit and adds finer scale structure • Works well with strongly clustered observations • Iterations stop when fine scale structure & fit to obs become commensurate with observation spacing and instrument error
Successive correction analysis strategy (cont) • Smooth blending with Background First Guess • Background subtracted to yield observation increments (uo) • Background (with zero increment) has weight at each grid point • Background weight proportional to inverse square of estimated error • wb = 1 / errb2 • For each iteration, analyzed increment (u) is as follows: • ui,j,k = (uowo) / ( (w o )+ wb )
Remapping Strategy • Polar to Cartesian • 2D or 3D result (narrowband / wideband) • Average Z,V of all gates directly illuminating each grid box • QC checks applied • Typically produces sparse arrays at this stage
Remapping Strategy (reflectivity) • Horizontal Analysis/Filter (Reflectivity) • Needed for medium/high resolutions (<5km) at distant ranges • Replace unilluminated points with average of immediate grid neighbors (from neighboring radials) • Equivalent to Barnes weighting at medium resolutions (~5km) • Extensible to Barnes for high resolutions (~1km) • Vertical Gap Filling (Reflectivity) • Linear interpolation to fill gaps up to 2km • Fills in below radar horizon & visible echo
Mosaicing Strategy (reflectivity) • Nearest radar with valid data used • +/- 10 minute time window • Final 3D reflectivity field produced within cloud analysis • Wideband is combined with Level-III (NOWRAD/NEXRAD) • Non-radar data contributes vertical info with narrowband • QC checks including satellite • Help reduce AP and ground clutter
Horizontal Filter/Analysis Before After
LAPS cloud analysis METAR METAR METAR
3-D Clouds • Preliminary analysis from vertical “soundings” derived from METARS, PIREPS, and CO2 Slicing • IR used to determine cloud top (using temperature field) • Radar data inserted (3-D if available) • Visible satellite can be used
Cloud/Satellite Analysis Data • 11 micron IR • 3.9 micron data • Visible (with terrain albedo) • CO2-Slicing method (cloud-top pressure)
Cloud Coverage without/with visible data No vis data With vis data
LAPS 3-D Water Vapor (Specific Humidity) Analysis • Interpolates background field from synoptic-scale model forecast • QCs against LAPS temperature field (eliminates possible supersaturation) • Assimilates RAOB data • Assimilates boundary layer moisture from LAPS Sfc Td analysis
LAPS 3-D Water Vapor (Specific Humidity) Analysis [continued] • Scales moisture profile (entire profile excluding boundary layer) to agree with derived GOES TPW (processed at NESDIS) • Scales moisture profile at two levels to agree with GOES sounder radiances (channels 10, 11, 12). The levels are 700-500 hPa, and above 500 • Saturates where there are analyzed clouds • Performs final QC against supersaturation
Adjustments to cloud and moisture scheme • Originally cloud water and ice estimated from Smith-Feddes parcel • Model – this tended to produce too much moisture and ice • Adjustments: • Scale vertical motion by diagnosed cloud amount, extend below cloud base • 2. Reduced cloud liquid consistent with 10% supersaturation of diagnosed water vapor and autoconversion rates from Schultz
Proposed Tasks for IA#15 • Transfer existing LAPS/MM5 Hot-Start system to CWB • LAPS build on LINUX • Expand satellite and radar data used for cloud diagnosis • Adapt to GOES 9 (visible + 3.9 micron) • Radar data compression needed? • CWB/NFS as background • Continued tuning for tropics • Add thermodynamic constraint to balance package to correct for bad background fields • Add a verification package to the LAPS/MM5 system – State variables and QPF • Continue regular upgrades CWB software
Sources of LAPS Information • The Taiwan LAPS homepage • http://laps.fsl.noaa.gov/taiwan/taiwan_home.html
Analysis Information LAPS analysis discussions are near the bottom of: http://laps.fsl.noaa.gov/presentations/presentations.html Especially noteworthy are the links for • Satellite Meteorology • Analyses: Temperature, Wind, and Clouds/Precip. • Modeling and Visualization • A Collection of Case Studies
LAPS (Local Analysis and PredictionSystem) Diabatic Initialization technique Hot-Start MM5 Taiwan Short-Term Forecast System Taiwan Short Term Forecast System
Forecast domains & Computational requirement 0.00 0.05 0.10 0.15 0.20 1km (169*151) 0.25 0.30 0.35 0.40 0.45 0.50 0.54 0.58 1260 km ( 141 points) 151 pts 0.62 30 Vertical layers (σ levels) 0.65 0.68 0.71 0.74 0.77 0.80 3km 151 pts 0.83 0.86 0.88 0.90 0.92 0.94 0.96 9km 0.97 0.98 1368 km ( 153 points) 0.99 1.00 CPUs 42 Need 1.5hrsfor 24hrs fcst compaq 833 MHz Forecast domains & computational requirements
CWB Hot-Start MM5 Model Configuration Domain1 Domain2 Grid-points 153*141*30 151*151*30 Horizontal Resolution 9 km 3 km 9 secs Time-Step 27 secs Nesting Two-way feedback between nests Lateral B.C. Relaxation/inflow-outflow (from CWB/NFS) Lower B.C. Daily SST and LAPS surface analysis Upper Radiative Condition Upper B.C. CWB Hot-Start MM5 Model Configuration
CWB Hot Start Physics CWB Hot-Start MM5 Model Physics Initial Field From LAPS and Diabatic Initialization Microphysics Schultz scheme PBL scheme MRF PBL Surface scheme 5-layer Soil Model Radiation RRTM scheme Shallow Convection YES Cumulus Parameterization NO