Download
1 / 24
240 likes | 379 Views
An integrated geospatial approach to monitoring the Bering Glacier, Alaska. Authors: Presenter: Ed Josberger – USGS John Payne Robert Shuchman – Altarum John Payne – BLM Sean Savage – Altarum Guy Meadows – University of Michigan. Outline. Background & Motivation Participants

E N D
An integrated geospatial approach to monitoring the Bering Glacier, Alaska Authors: Presenter: Ed Josberger – USGS John Payne Robert Shuchman – Altarum John Payne – BLM Sean Savage – Altarum Guy Meadows – University of Michigan
Outline • Background & Motivation • Participants • Geospatial Approach • Examples • Summary
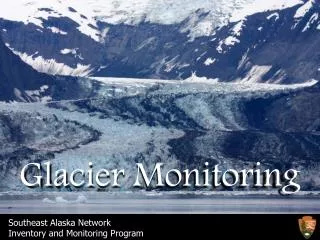
Bering Glacier Background • Largest and longest glacier in continental North America (area 5,175 km2 / length 190 km) • 6% area of glacier ice in Alaska (15-20% of total ice in Alaska) • Largest surging glacier in America (last surge 1993-95) • Rapid ongoing retreat of the glacier and expansion of Vitus Lake has established new flora and fauna habitats • Post surge retreat of glacier has created a dynamic landscape of reticulated and fluted surfaces with subtidal invertebrate fossils, lake sediments, and previous overrun forests. • Given current climate change scenarios, Bering may undergo a dramatic retreat, giving a dramatically different landscape.
Bering Glacier Motivation • Bering Glacier region is biologically and environmentally significant • Last 100 years have brought significant changes to human access to the glacier • Early 1900’s subsistence hunters, fisherman, trappers, and miners • WWII and Cold War brought airstrips to Cordova and Yakutat • 1960’s brought oil development • 1990’s – big game hunting and fishing • 2000 – public cabins and eco-tourism access • 1971 Alaska Native Claims Settlement Act gave mineral rights near Berg Lake to local native corporation who sold rights to Asian corporation • New land use plan under development by BLM Glennallen District for Bering Glacier • Application is pending for Bering Glacier region to become Research Natural Area
Bering Glacier Scientific Highlights • BLM investigators represent federal, state, academic, and NGO organizations • Scientific disciplines include: • Bering Glacier observations (terminus, ice movement, ablation, thickness, berg calving rate, ice depth, and sub-glacial geology) • Bering Glacier System Hydrological Studies (river flow rates, tidal actions, and rainfall) • Vegetation studies (mapping flora (species) communities surrounding glacier) • Water properties of Vitus, Berg and other Bering Glacier lakes (bathymetry, CTD, DO, pH, turbidity, ORP, salinity, and total dissolved solids) • Paleontology and Paleoseismology (fossil and plant analysis in estuarine, lake and glacial outwash areas) • Geology, geomorphology, and sea level studies (moraine deposits, examination of thermokarsts, and coastal and lake sediments) • Seal population studies (count, behavior and food source) • Fish population (species, count and size) • Remote sensing (mapping) of the Bering Glacier area • Hazard modeling and mitigation • Environmental monitoring
Site Selection Query & Visualization Navigation Integration & Analysis Data Capture & Archive Role of GIS in Bering Field Studies • GIS has been incorporated into every phase of the Bering Glacier program to combine in situ data, remotely sensed data and models to better understand the environmental dynamics • The GIS framework has been used for: • Selection of field sampling sites • Navigation to and from sampling sites • Data capture and archive • Data integration and analysis • Data storage, query and visualization
Specific Examples ofBering Glacier Geospatial Analyses • Glacier retreat as a function of time • Iceberg calving rates • Volumetric and area change of Vitus Lake as a function of glacial retreat • Scientific visualization of Vitus Lake water masses • Multi-parameter water quality analysis of glacial lakes within the Bering system as a function of proximity to the glacier
Terminus Position Analysis • Identifying and tracking the terminus position of the Bering Glacier at Vitus Lake useful in several respects: • Tracking rates of terminus retreat • Estimating areas minimum and maximum change • Identifying particularly dynamic sections of the terminus • Facilitating lake area and volume dynamics by delineating the lake boundary • A multi-date archive of the terminus front at Vitus Lake has been derived from a sequence of Landsat images from 1999 to 2003 • These images were co-registered to assure that positional changes can be attributed to glacier dynamics and not mis-registration • The terminus to lake interface was then digitized for each year
Only 5-months lapsed between 2002 and 2003 observations, mostly spanning the winter months. Bering Glacier Terminus: 1995-2003
Remote Sensing of Icebergs • The presence of icebergs in Vitus Lake serves not only as a hydrologic indicator, but also as a ecologic indicator • Hydrologic: Iceberg counts and sizes are an indicator of calving processes • Ecologic: Iceberg counts, sizes and distribution patterns may be an indicator of habitat, such as seal haul-outs • Icebergs, however, are very dynamic and difficult to observe in the field • Accordingly, remote sensing is well-suited to monitoring and analyzing iceberg activity • The icebergs of Vitus Lake were identified and digitized from Landsat 7 images for 2002 and 2003 using GIS
2002 2003 Icebergs of Vitus Lake
Iceberg Summary • Preliminary summary of findings: • Icebergs will be identified and digitized in each of the remaining Landsat images (1999-2001,2004) • The potential of SAR data to distinguish icebergs is currently being explored, which will benefit this analysis by: • Eliminating the issue of cloud cover, producing a more complete archive • Increasing the temporal resolution to perhaps monthly or at least seasonally, thereby allowing potential correlation with climatic patterns • Facilitating data acquisition to coincide with field campaigns, allowing potential correlation with other observations (such as seal counts)
Bering Glacier Bathymetry • Using GIS, we interpolated detailed bathymetric survey data into a continuous lake bottom map for Vitus Lake • The interpolated bathymetry provided the basis for a volumetric and area change analysis using the previously derived terminus positions and lake boundaries • This bathymetric data is also central to understanding the spatial variability and patterns of water quality hydrology of Vitus Lake
1995 1999 2000 2001 2002 2003 Bering Glacier Bathymetry: 1995-2003
Vitus Lake Volumetric Dynamics • The volume of Vitus Lake has increased over %170 • The area of Vitus Lake has nearly doubled since 1995 *Only 5-months lapsed between 2002 and 2003 analysis points, largely spanning the months of minimal terminus activity.
Scientific Visualization ofVitus Lake Water Masses • GIS was used to visualize project data in many ways to gain new perspective and understanding • Analyzing water quality parameters in the context of GIS derived bathymetric data allowed identification and visualization of vertical structure in Vitus Lake • Four distinct water masses were found: • Warm freshwater, surface layer • Cold intermediate layer • Saline, deep water layer • Turbid bottom layer
A B C D E Water Quality Spatial Profiling
Water Quality Parameters • Over the 2002-2003 field season, over 100 in situ measurements have been made using a Horiba water quality monitoring system and a CTD. • Measured parameters include: • pH – Conductivity • Turbidity – Dissolved Oxygen • Total Dissolved Solids – Oxydation Reduction Potential (ORP) • Salinity – Temperature • Depth • All sample locations were geospatially referenced in GIS using coincident GPS point collections. • Samples were collected by foot, by boat and from a helicopter.
Glacial Lakes Sampling Summary • 65 Lakes sampled in total: • Several water quality parameters exhibit some rudimentary spatial patterning that will help guide additional sampling • Observed patterns are being compared with spatial distribution of observed flora and fauna to determine if any correlation exists
Summary • In situ and remote sensing data, combined with modeling in a GIS framework provided insight into environmental habitat changes due to glacier dynamics • Without such an integrated approach, the ability to understand and analyze any one component of this program would be diminished