Download
1 / 50
510 likes | 650 Views
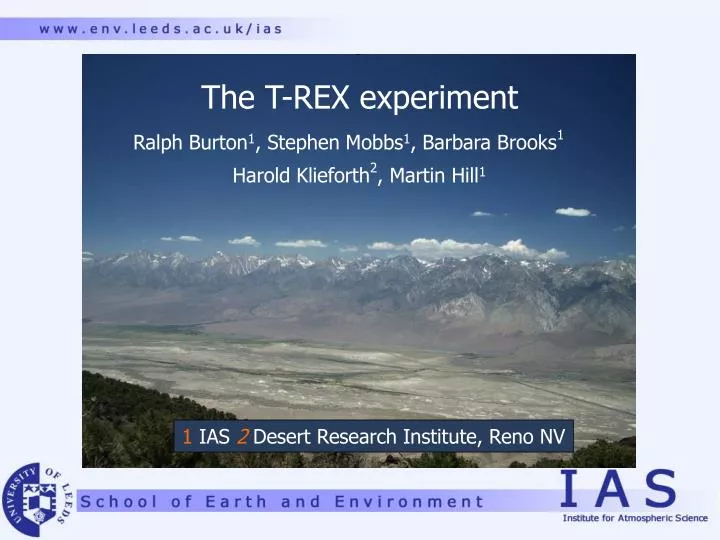
The T-REX experiment. Ralph Burton 1 , Stephen Mobbs 1 , Barbara Brooks 1. Harold Klieforth 2 , Martin Hill 1. 1 IAS 2 Desert Research Institute, Reno NV. 1. Motivation. 2. Rotors: brief overview. 3. T-REX. From. “ Hazardous Mountain Winds and their Visual Indicators ”

E N D
The T-REX experiment Ralph Burton1, Stephen Mobbs1, Barbara Brooks1 Harold Klieforth2, Martin Hill1 1 IAS 2 Desert Research Institute, Reno NV
1. Motivation. 2. Rotors: brief overview. 3. T-REX.
From “Hazardous Mountain Winds and their Visual Indicators” Federal Aviation Authority, U.S.Dept. of Transportation, 1988
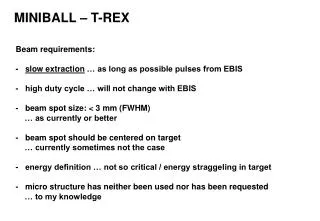
Accidents not limited to one operating altitude, • or time of year, or specific type of aircraft • In many cases, other aircraft operating in the • vicinity of the accident encountered only weak • turbulence severe wind events can be highly localised, violent, and short-lived
From “Hazardous Mountain Winds and their Visual Indicators”, 1988 Accident rate 40% higher in the 11 mountain states Accident rate less than 3 per 100,000 Accident rate greater than 3 per 100,000
DEM of the U.S. showing regions of elevated terrain
From http://adds.aviationweather.gov
Extensive mountain obscuration For aviation weather reports, see http://adds.aviationweather.gov
Owens (dry) lake • Probably the largest single source of • PM10 dust in the United States • Dust plumes tracked to 3000m AGL, • 100 km north of the lake • Affects visibility and vegetation • in many neighbouring wilderness • areas • Dust storms regularly cause • suspension of operations at • China Lake Naval Weapons Center From Reheis (1997) See geochange.er.usgs.gov/sw/impacts/geology/owens
Sierra wave Project (1950s) W I Looking South from 9800m/32000ft
Sierra Wave Project (1950s) Flight of Feb. 16th 1952 From Holmboe and Klieforth 1957
A: Type 1 rotor B: Type 2 rotor From Kuettner (1959)
Maximum rates of climb Cessna 172: 720 ft/min Ibis aerospace 270: 1791 ft/min Boeing Chinook: 1840 ft/min
Sierra Wave Project (1950s) Flight of Feb. 16th 1952 W=-31ft/s w=+41ft/s From Holmboe and Klieforth 1957
Rotor: -1860ft/min Maximum rates of climb Cessna 172: 720 ft/min Net downward Net downward Ibis aerospace 270: 1791 ft/min Net downward Boeing Chinook: 1840 ft/min
“Type 1” rotor
“Type 2” rotor
“Inversion effects on mountain lee waves” Vosper, QJR 2003 Inversion height Wind constant with height
Regime diagram BLASIUS; idealised ridge H = hill height zi = inversion height; Fi = U/(g’zi)1/2 g’ = g/0 U = background wind
H/Zi > 0.3 Consider u=10 ms-1 surf temp = 200C, Zi = 3600m, then we have U2 ~ 45 gives ~ 2K
Climatology of wave events Based upon satellite imagery, 1km resolution, 15 minute intervals (visible channel) From Grubišić, T-REX proposal
Oct 29th 2000 GOES -Vis From Doyle and Durran (2004)
Regime diagram “Inversion effects on mountain lee waves” Vosper, QJR 2003 29/10/2000
Doyle and Durran (2004) Coupled Ocean-Atmospheric Mesoscale Prediction System (COAMPS) • Fully 3-d simulation using 5 nested grids, finest resolution x=333m • Fully compressible, nonhydrostatic • Mixing length scheme • Terrain-following coordinates
T-REX The biggest field campaign ever mounted to study rotors/gravity waves ARL White Sands Missile Range Scripps Institute of Oceanography Colorado Research Associates Cooperative Research in Environmental Science Desert Research Institute DLR Lawrence Livermore National Laboratory UK Met Office NASA NCAR Naval Research Laboratory NOAA Arizona State University Colorado State University Harvard University University of Houston University of Innsbruck University of Leeds University of New Hampshire North Carolina State University Stanford University University of Utah Yale University
Masts currently installed in the Owens Valley (DRI) See www.wrcc.dri.edu/trex
Roll cloud observed over the Owens Valley, April 2004 Photo by James Pinto
Roll cloud over Owens Valley March 24 2004 From Grubišić and Cohn (2004)
T-REX Phase I From Grubišić and Kuettner (2004) From Grubišić and Cohn (2004)
Location of proposed Leeds masts National Forest Service Inyo Valley Dept. of Water Resources Sierra Bureau of Land Management
Sonic anemometer Temperature sensors GPS aerial Solar panel Logger box Batteries
T-REX IOP: March – April 2006 • At least 28 10m towers • Wind profilers • Lidars • Radiosondes • NCAR Gulfstream • Univ. of Wyoming King Air • FAAM BAe146 • 50 temperature loggers • 3 x 30m flux towers • Univ. Innsbruck mobile • met system • …
T-REX Phase II Map: V. Grubišić in collaboration with the UCAR Joint Office of Scientific Support
T-REX Phase II Typical flight plans Schematic: V. Grubišić and J. Doyle
Rotors – some key scientific questions Climatology: - frequency,preferred location Dynamics • to establish the conditions required • for the formation of rotors Modelling - Ability of current models to predict the occurrence of rotor events - Model validation
Summary Rotors pose a severe aviation hazard and have been cited as being responsible for several major accidents. Still poorly understood. • Preparations in place for the most comprehensive • field campaign to study rotors/lee waves ever made, • using AWS, lidars, aircraft, flux towers, … • Permissions granted for installation of a further 12 • 10m towers: deployment early 2005 • Phase I completed; some case studies already being • undertaken in the US


![T-REX [ TAMU Re accelerated EX otics ]](https://cdn1.slideserve.com/1943251/slide1-dt.jpg)