Download
1 / 23
230 likes | 357 Views
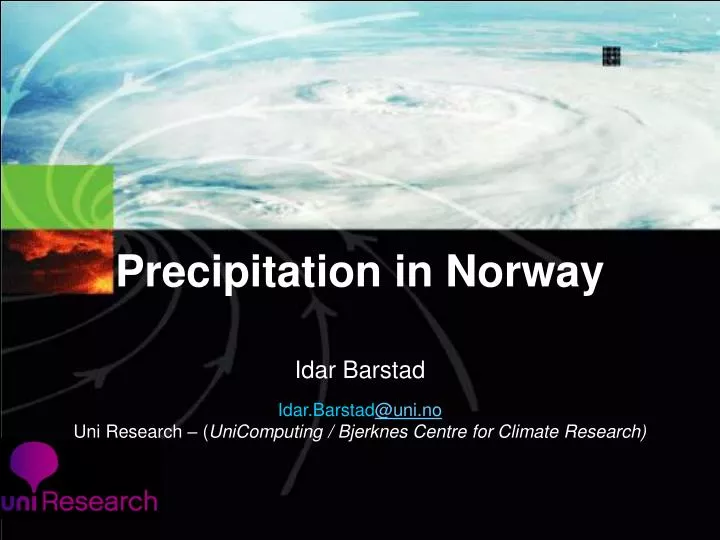
Precipitation in Norway Idar Barstad Idar.Barstad @uni.no Uni Research – ( UniComputing / Bjerknes Centre for Climate Research). Motivation: Orographic precipitation and climate change Results from a small-scaled field campaign. Nesttun, 14th September 2005.

E N D
Precipitation in Norway Idar Barstad Idar.Barstad@uni.noUni Research – (UniComputing / Bjerknes Centre for Climate Research)
Motivation: Orographic precipitation and climate change Results from a small-scaled field campaign
Return period /-amount for Bergen (daily data) x Return value (mm/day) 2 months later 1 100 1000 Return period (years)
14th Nov 2005 NERSC/NASA
Pressure patterns leading up to extreme precipitation Cluster # -2 days Extreme day 2 -2 days Extreme day 3 (Barstad and Sorteberg, 2012, in prep.)
ARPEGE (HADCM3) ARPEGE (GFDL) Mean precipitation Norway – whole year Sorteberg & Kvamstø, 2008
The study Increasing demand of products from numerical models of high resolution Q: Can models deliver what we ask for?
Experimental set-up Collect precipitation using rain gauges (“tipping” buckets) For 12 weeks 2006 across an island at the west coast of Norway Run numerical model - WRFV3.3, 9-3-1 km, MYJ, Thompson MP - spectral nudging (>1000km), 45-15-5 sec time step Material from a submitted paper (Barstad, 2012 ; QJRMS)
Domain 9-3-1 km domain ~500 m peaks 10 km Contours every 50 m
Total precip 3 km frontal 3 km convective Vertically int. water vapor rose
2 9 18 10 8 1 mod/obs
Precip at high percentiles (10min accumulation) OBS mod
Time-step prec OBS 1 km 3 km (0.2 mm per tip)
Time-step prec OBS 1 km 3 km
WRF and shallow convection C Vincent (2010)
Zoom in on the convection It doesn’t seem to be as well defined and organized as suggested by the model
Thank you! Email: Idar.Barstad@uni.no
Extreme precipitation – w Norway A1B scenario – downscaling using 12 GCM models Caroletti and Barstad (2009)