Download
1 / 14
150 likes | 519 Views
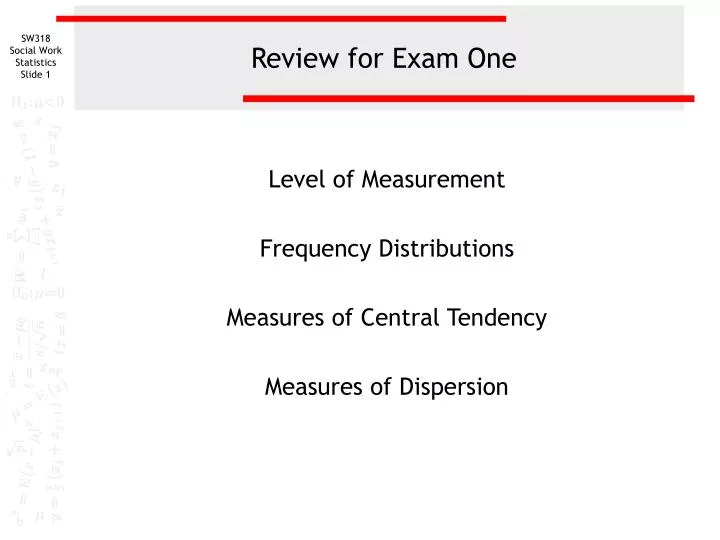
Review for Exam One. Level of Measurement Frequency Distributions Measures of Central Tendency Measures of Dispersion. Level of Measurement.

E N D
Review for Exam One Level of Measurement Frequency Distributions Measures of Central Tendency Measures of Dispersion
Level of Measurement • Level of measurement defines the mathematical operations (e.g. counting, adding, dividing, etc.) and the statistics that are permissible for a particular type of variable. • Levels of measurement: • Interval level • Ordinal level • Nominal level • Dichotomous
Interval Level Variables • The numeric score represents the measure or amount of a characteristic that a subject has. • Permissible arithmetic: counting, sorting, and addition, subtraction, multiplication, division. • Examples: GPA, SAT score, age, income
Ordinal Level Variables • The numeric score represents a subject's rank with respect to whether they possess more or less of a trait or have a higher or lower rank on a scale. • Permissible arithmetic: counting, ranking or sorting • Examples: social class, letter grades (A, B, C, etc.)
Nominal Level Variables • The numeric score represents the class or category to which a subject belongs, i.e. the number represents a category. • Permissible arithmetic: counting • Examples: race, religion, marital status
Dichotomous Variables • Dichotomous variables are a special type of nominal level variable that contain only two categories. • We distinguish dichotomous variables from nominal variables because there are special “proportion” statistics available for dichotomous, or two-category nominal variables. When we are not using these special statistics, we treat dichotomous variables the same as nominal variables. • Examples: sex, residency, citizenship
Frequency Distributions: Application • Statisticians use frequency distributions to answer the following questions: • The number of cases in a category, e.g. 47 • The percentage or proportion of cases in a category, e.g. 22.35% or 0.2235 • The probability of being in a category, e.g. 0.2235 • The ratio of one category to another, e.g twice as many females as males • The most likely or least likely category in a distribution, e.g. students were most likely to be in the academic program • The cumulative number, proportion, or probability of a category and all categories above or below, e.g. 60% of the students made grades of C or better
Frequency Distributions: Measures Frequency distributions can measure the frequency (count), percentage, cumulative frequency and percentage. Usable measures are dependent on a variable’s level of measurement
Frequency Distributions: Issues • All frequency distributions must have categories that are exhaustive and mutually exclusive, i.e. each case in a sample can be counted in one and only one category. • For interval variables, we create categories called class intervals that contain a range of scores, e.g. 0 to 10, 11 to 20, etc. Choosing a different number of intervals can make the distribution of the data appear very different.
Measures of Central Tendency Measures of central tendency are statistics that summarize a distribution of scores by reporting the most typical or representative value of the distribution.
Measures of Central Tendency: Interpretation • The mean is interpreted as the average score. • The median is interpreted as the central or middle score. • The mode is interpreted as the most common score. • When comparing groups, the mean and median are interpreted as one group having a lower, higher, or similar mean or median to the other group. The mode is interpreted as being the same or different for both groups.
Measures of Central Tendency: Issues • The mean uses the data for all cases in the distribution. Unusually large or unusually small scores have a large effect on the mean, making it less useful as a measure of central tendency. For a skewed distribution, the median is the preferred measure of central tendency. • Unusually large or unusually small scores have no impact on the median of a distribution since only the middle scores are used in computing it. • Not every distribution has a single mode. Some distributions are bimodal or multimodal.
Measures of Dispersion Measures of dispersion are statistics that indicate the amount of variety or heterogeneity in a distribution of scores.
Measures of Dispersion: Interpretation • Measures of dispersion indicate the degree to which cases in the distribution differ from the measure of central tendency. • For all measures of dispersion, higher values represent greater dispersion or diversity among cases. • When comparing groups, the group with the larger measure is interpreted as the more diverse group.