Download
1 / 22
220 likes | 346 Views
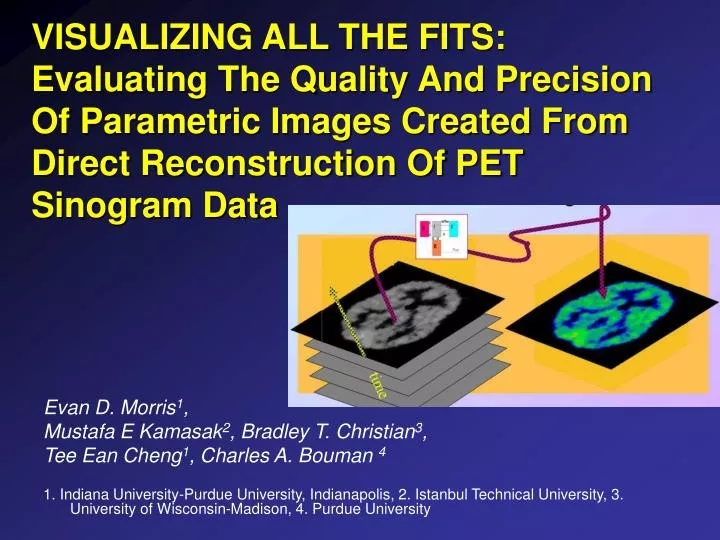
VISUALIZING ALL THE FITS: Evaluating The Quality And Precision Of Parametric Images Created From Direct Reconstruction Of PET Sinogram Data. Evan D. Morris 1 , Mustafa E Kamasak 2 , Bradley T. Christian 3 , Tee Ean Cheng 1 , Charles A. Bouman 4

E N D
VISUALIZING ALL THE FITS: Evaluating The Quality And Precision Of Parametric Images Created From Direct Reconstruction Of PET Sinogram Data Evan D. Morris1, Mustafa E Kamasak2, Bradley T. Christian3, Tee Ean Cheng1, Charles A. Bouman 4 1. Indiana University-Purdue University, Indianapolis, 2. Istanbul Technical University, 3. University of Wisconsin-Madison, 4. Purdue University
Dynamic PET • PET accumulates/averages the emissions of voxels. • Time resolution can be achieved by dividing data into time frames. • Used in imaging heart perfusion, brain activation, glucose metabolism, receptor binding • Time response of voxels is governed by ODEs • Parameters of ODEs are physiologically relevant
2-Tissue Compartment Model Typically used to describe… – Glucose metabolism imaging (FDG) – Receptor availability imaging (11C-raclopride,18F-fallypride) CP, CF, CB - Plasma, Free, and Bound tracer molar concentrations s = (k1, k2, k3, k4) – kinetic parameters at voxel s Time variation of molar tracer concentrations at voxel s PET signal at voxel s,
Our Approach: Direct Parametric Image Y Y • Notation • Y - Sinogram data • - parametric image • Objective • Directly reconstruct from Y • Problem • Nonlinear reconstruction k3
Context for Direct Reconstruction • Indirect reconstruction • Reconstruct a time-sequence of PET images, and then estimate the kinetic parameters for each voxel. (O’Sullivan and Saha 1999; Zhou 1998, 1999, 2001, 2003) • Semi-direct methods • Reconstruct a 4D PET image using splines in time. Then estimate kinetic parameters for each voxel. (Leahy et al. 2002; Reutter et al. 2000, 2004) • Use PCA or subspace methods. Then solve the resulting linear problem. (Wernick et al. 1997, 1999, 2000, 2002) • Direct reconstruction proposed by Carson and Lange in 1985 • Proposal based on EM algorithm for tomographic component • No specific proposal for handling kinetic or prior models • Direct reconstruction algorithm – (Kamasak, et al. TMI 2005) • Directly compute the image of kinetic parameters from the sinogram data. • Computes MAP estimate of parametric image using general prior model • Can also estimate blood input function
Direct Reconstruction • Reconstruction is given by • Y is the sinogram data • A is the forward projection matrix (i.e., the scanner model) • F() is the kinetic model (i.e., the emission image) • is the image of kinetic parameters (i.e., the parametric images) • S () is the stabilizing function (i.e., the spatial regularizing function) • Λ is the noise covariance • For Poisson noise • How do we compute the solution? Parametric ICD algorithm (PICD)
Parametric ICD Algorithm • Computes the solution to • Optimization • ICD optimization for tomographic part of problem • Nested optimization of both linear and nonlinear parts of kinetic model • Allows regularization of general nonlinear transform of parameters • Can directly reconstruction parameters that are physiologically important • Robust convergence, but to local minimum
k3 K1 P F B k2 k4 k2 Direct Reconstruction of Monkey Images from 18F-fallypride Data k3 K1 k4 BP VD
How will we use the parametric images? • Map the distribution of binding sites in a single subject over the whole brain. • Evaluate the effects of a drug or treatment on binding sites or kinetic rate constants across the whole brain – within subject comparison. • Compare the distributions of binding site or rate constant - between groups of subjects.
Present goal: To validate parametric images: • Check that (kinetic) model is ‘correct’. • Determine accuracy of images. • Determine variance of images.
data model How good is the fit of the model to the data in sinogram space? fit of events vs. distance sinogram data with line through single angle residuals of fit vs. distance
How good is the fit of the model to the data in image space? This is a big visualization problem. Filtered Back-project residuals from sinogram space to image space. Correlated error -> reject model. Uncorrelated error -> accept model.
k3 K1 P F B k2 k4 K1 P F k2 Filtered back-project residuals into image space emission image 4-param. model 2-param. model
Time sequence of FBP’d residuals 4-parameter model gives better fit. 2-parameter model produces spatial clusters in FBP’d residuals
Accuracy of Direct Reconstruction Simulated Rat Brain Data TRUE INDIRECT DIRECT Kamasak, et al. (2005)
Error in Direct ReconstructionMonte Carlo simulations using 18F-fallypride monkey data Parametric images Coefficient of variation images Parametric images (ground truth) are forward projected; Poisson noise is added to sinograms multiple times and direct reconstruction is applied to each realization.
Understanding the Error Images low coeff. of variation: striatum, cortex high coeff of variation: CSF, muscle (outside skull) k3 image k3 coeff. of variation
Experimental Results • Protocol: • Bolus injection of 18F-fallypride into rhesus monkey • 220 min data acquisition on Siemens HR+ • (6X0.5min; 7X1min; 5X2min; 4X5min; 18X10min) • Corrected for randoms, deadtime, scatter (CTI algorithm), attenuation and normalization • Fourier rebinning to 2D sinograms • Arterial blood samples collected throughout acquisition • Plasma input function corrected for metabolites
k3 K1 P F B k2 k4 k2 Parametric Images of 18F-fallypride(rhesus monkey) Regularization k3 K1 k4 Case 1 BP VD
K3 k3 K1 P F B k2 k4 k4 Parametric Images of 18F-fallypride(rhesus monkey) K1 Regularization k2 Case 2 BP VD
Selection of regularization parameters Regional estimates of binding potential ratios – gold standard. Case 2 yields best agreement with regional gold standard values.
Summary • Direct reconstruction has been implemented and successfully applied to simulated and experimental PET data. • Appropriate (kinetic) model order can be determined by examination of filtered-back-projected residual images. • Variance of parametric images has been calculated and appears small in gray matter areas. • ROI based estimates agree with our results using appropriate regularization. Thanks to Mike Casey and Charles Watson of CTI for scatter correction code