Download
1 / 26
260 likes | 274 Views
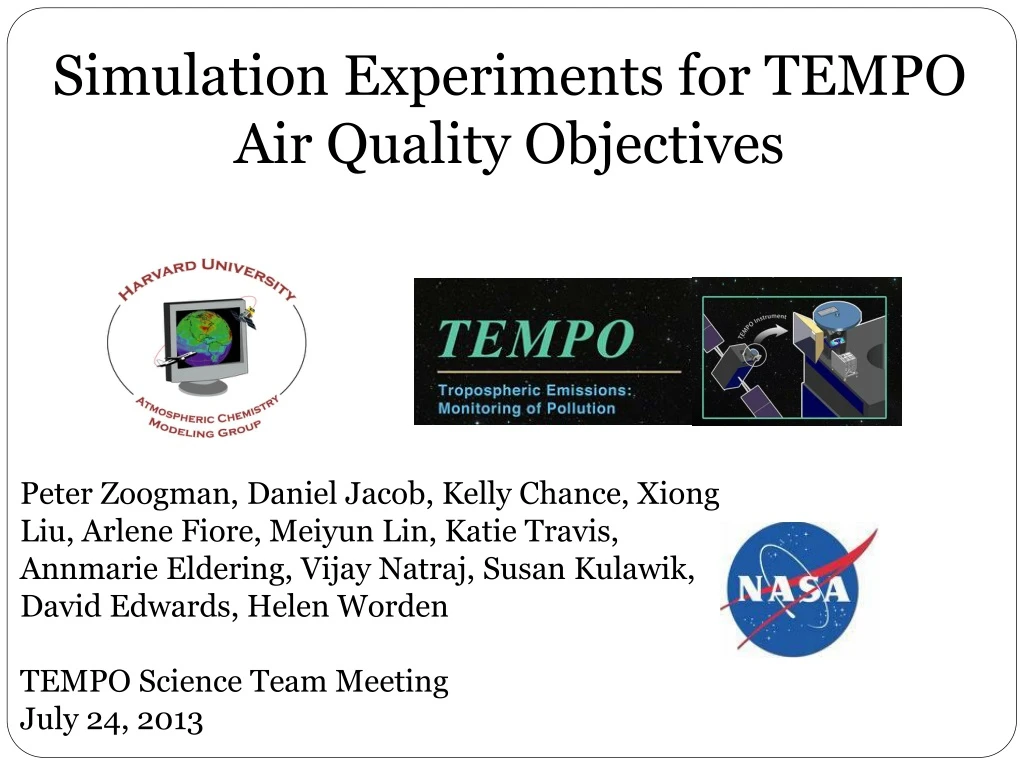
Simulation Experiments for TEMPO Air Quality Objectives. Peter Zoogman , Daniel Jacob , Kelly Chance, Xiong Liu, Arlene Fiore, Meiyun Lin, Katie Travis, Annmarie Eldering , Vijay Natraj , Susan Kulawik , David Edwards, Helen Worden TEMPO Science Team Meeting July 24, 2013.

E N D
Simulation Experiments for TEMPO Air Quality Objectives Peter Zoogman, Daniel Jacob, Kelly Chance, Xiong Liu, Arlene Fiore, Meiyun Lin, Katie Travis, AnnmarieEldering, Vijay Natraj, Susan Kulawik, David Edwards, Helen Worden TEMPO Science Team Meeting July 24, 2013
The Difficulty of Ozone Air Quality from Space • Ozone concentrations very heterogeneous both spatially and temporally DIAL over Huntsville, AL [Newchurch et al, 2009] • Ozone chemistry complex and non-linear • Short timescales large diurnal variation • NAS/EPA: current ground/sonde network inadequate for air quality monitoring [Fishman et al. 2008]
Observing System Simulation Experiment a priori = GEOS-Chem model “True” = independent model a posteriori= GEOS-Chem + assimilation of synthetic observations attempt to reproduce “true” atmosphere • What additional information is provided by addition of a new instrument? Instrument Specification Synthetic Observations a priori Model “True” Model Assimilation a posteriori Model Comparison and Evaluation
Science Questions • What are the measurement requirements for geostationary observations to constrain ozone in the boundary layer? • How can we use TEMPO observations to monitor and attribute air quality exceedances? • Can concurrent geostationary measurements of CO improve monitoring of surface ozone air quality through a joint assimilation?
Data Assimilation Create synthetic observations “Truth” GEOS-Chem optimal estimate assimilate integrate to next time step
Simulation Models • “Truth” and GEOS-Chem are completely different • Meteorology, Chemistry, Emissions
Air Quality Information from GEO Error in Surface MDA8 Ozone averaged for July 2001 [Zoogman et al, 2011] Need to combine observations in multiple spectral regions at high temporal resolution to constrain ozone air quality
Comparison of Spectral Combinations Error in ozone surface air concentration over the US after assimilation of observations in different spectral combinations [Zoogman et al, 2011]
North American Background Ozone • O3 that would occur in the absence of anthropogenic emissions in the U.S., Canada, and Mexico. • Sets limit on levels achievable through domestic controls • Highest in the intermountain West [Zhang et al. 2011]
Surface Measurements from CASTNET CASTNet ozone monitoring sites in the continental United States Sites in the intermountain West in red. • Surface measurements can provide information in their vicinity • Horizontal = 510 km, Vertical = 1.7 km
Seeing a Stratospheric Intrusion [Lin et al. 2012]
Seeing a Stratospheric Intrusion [Lin et al. 2012]
Usefulness of CO Observations • O3:CO correlations are well known • GCIRI boundary layer sensitivity may be greater for CO than TEMPO ozone [Hudman et al, 2009] CO sensitivity, MOPITT Theoretical Ozone sensitivities [Natraj et al 2011 and Worden et al 2010]
The Case for Error Correlations • Model errors correlated => CO observations could add information for ozone air quality by constraining model transport error
The Case for Error Correlations • Model errors correlated => CO observations could add information for ozone air quality by constraining model transport error • But! model error correlations can differ greatly from concentration correlations!
Air Quality Information from Error Correlations Air Quality Error for August 2006 Error Correlations provide additional information for surface ozone (spatial pattern consistent with regions of strong error correlation)
Conclusions • OSSEs have been used to make the case for GEO UV+Vis design • TEMPO will provide the capacity to monitor NAAQS exceedances • High temporal and vertical resolution will allow viewing/attribution of exceptional events • CO observations from GCIRI could improve on TEMPO near surface ozone
Multispectral Satellite Observations of Ozone Averaging Kernel matrix A quantifies the vertical information provided by a satellite retrieval Ozone sensitivity, future Current ozone sensitivity, OMI (UV) [Zhang et al. 2010] [Natraj et al, 2011]
Surface Ozone Sensitivity • Adjoint model – receptor based rather than source based approach • Sensitivity of surface ozone to ozone produced at each vertical layer [Zoogman et al, 2011] Surface ozone primarily sensitive to production below 2 km
Surface Measurements from CASTNET • Distance/Magnitude of correction is quantified by the ozone error correlation • Find correlation of model error at each pair of CASTNet sites R=0.50, D=340 km
Surface Measurements from CASTNET • Distance/Magnitude of correction is quantified by the ozone error correlation • Find correlation of model error at each pair of CASTNet sites R=0.50, D=340 km • Plot R vs. distance to find error correlation length scale
The Case for Error Correlations • Negative model error correlations reproduced when comparing to aircraft observations