Download
1 / 43
440 likes | 852 Views
Modeling the Origin and Migration of Human Populations . Michael E. Palmer. Overview. History Some Population Genetics origins of genetic variation evolutionary timescales selection and drift neutral theory Detection of Selection in Humans with SNPs Some more Population Genetics

E N D
Modeling the Origin and Migrationof Human Populations Michael E. Palmer
Overview • History • Some Population Genetics • origins of genetic variation • evolutionary timescales • selection and drift • neutral theory • Detection of Selection in Humans with SNPs • Some more Population Genetics • Migration • Wright’s FST • Inference of Human Phylogenetic Tree • Time to Most Recent Common Ancestor (TMRCA) • Unique Origin vs. Multiregional Evolution Models • Geographic Origin of Humans
History of Study of Human Variation • Blood proteins (ABO gene, 1919) • Radioisotopes to study DNA • Polymerase Chain Reaction (PCR), 1986 • method to “amplify” (copy) a piece of DNA • led to an explosion of DNA sequence data • Almost every protein has genetic variants • These variants are useful markers for population studies
Number of cell divisions from one generation to next Mouse Human Male ~40 ~400 Female ~20 ~23 Exceptions Hypermutable sites C->T = 10x avg point rate Simple Sequence Repeats 10-1000x indel rate (some 10-4!) mitochondrial DNA 10-100x nuclear point rate Origins of Genetic Variation 1 generation How often does this happen per generation? (germ line matters, not soma) Rate of Genetic Events (avg) in Mammals Point substitution (nuc) ~0.5 x 10⁻⁸ per bp Microdeletion (1-10bp) about 1/20 of point Microinsertion (1-10bp) about half of mdel Recombination ~10-10 Mobile element ins’n ~10-11 Inversion ?? much rarer Source: A. Sidow, BIOSCI 203
Eukaryotes: 109 years Human Family 100 years … Accumulation of Variation over Time Mammals:108 years Apes: 107 years Humans: 105–106 yrs Source: A. Sidow, BIOSCI 203
Drift and Selection • Drift • Change in allele frequencies due to sampling • a ‘stochastic’ process • Neutral variation is subject to drift • Selection • Change in allele frequencies due to function • ‘deterministic’ • Functional variation may be subject to selection (more later) The two forces that determine the fate of alleles in a population Source: A. Sidow, BIOSCI 203
Genetic Drift 1 From Li (1997) Molecular Evolution, Sinauer Press, via A. Sidow BIOSCI 203
Genetic Drift 2: Population Size Matters 4 populations 2 at N=25 2 at N=250 From Li (1997) Molecular Evolution, Sinauer Press, via A. Sidow BIOSCI 203
Genetic Drift over time – expected values Principles of Population Genetics, Hartl and Clark
Genetic Drift over time – expected values Principles of Population Genetics, Hartl and Clark
Selection 1: Fitness • viability = chance of survival to reproductive age • one measure of fitness • If fitness depends on genotype, then we have selection • if organisms live/die independent of genotype, that’s drift Source: A. Sidow, BIOSCI 203
Selection 2: Measuring Fitness • Normalized relative fitness: w • Selection coefficient: s = 1-w normalized to this allele → • Sometimes normalized to “most fit” (then s ≤ 0) • Sometimes normalized to average fitness
Effective population size Ne • Sewall Wright (1931, 1938) • “The number of breeding individuals in an idealized population that would show the same amount of dispersion of allele frequencies under random genetic drift or the same amount of inbreeding as the population under consideration". • Usually, Ne < N (absolute population size) • Ne != N can be due to: • fluctuations in population size • unequal numbers of males/females • skewed distributions in family size • age structure in population
e If |s| > 1/Ne, then P(fix) = e 1 - e-4 N sq 1 - e-4 N s Selection vs Drift 1: |s| and Pop Size If |s| < 1/Ne, then selection is ineffective and the alleles are solely subject to drift: the alleles are “effectively neutral” What is the probability of fixation? If |s| < 1/Ne, then P(fix) = q Ne = effective pop size s = selection coefficient q = allele frequency Source: A. Sidow, BIOSCI 203
Selection vs Drift 2: |s| and Pop Size Around the diagonal, where inverse of pop size is close to |s|, selection and drift are in a tug-of-war. Source: A. Sidow, BIOSCI 203
time Allele arises but fades away (by selection and/or drift) Allele arises and moves to fixation (by selection and/or drift) Evolutionary Change (fixation) Let’s look at a single nucleotide site in the genome TTA TTA TCA TCA p = 1.0 p = 0.6 q = 0.4 p = 1.0 Source: A. Sidow, BIOSCI 203
Neutral theory (Kimura) • How do mutation & drift interact, in absence of selection? • Probability of eventual fixation (of a neutral allele at frequency p0) • p0 • E.g., for a new mutation in diploid pop: p0=1/2Ne • Average time to fixation of a neutral allele • 4Ne generations • Rate at which neutral mutations are fixed (mutation rate is ) • (does not involve Ne) • Average time between consecutive neutral substitutions • 1/ • Average homozygosity at equilibrium, using infinite alleles model • 1/(4Ne+1)
Neutral theory Diagram showing trajectory of neutral alleles in a population. New allelles enter the population by mutation and have an initial allele frequency of 1/2N. Most alleles are lost, but those that go to fixation take an average of 4N generations. The time between successive fixations of neutral alleles is 1/ generations. • A moderate size population. • The same population size; a higher mutation rate gives the same time to fixation, but less time between fixations. • A smaller population has alleles that go to fixation more rapidly, but the time between fixations is still 1/. (After Kimura 1980.) Principles of Population Genetics, Hartl and Clark
Definition: SNPs • SNP = Single Nucleotide Polymorphism • polymorphism = the presence of two or more alleles of a gene or other DNA sequence in a population. • for example: • 42% of individuals have ...CATTACTAGTG... • 58% of individuals have ...CATTGCTAGTG... • SNPs typically arise from point mutations
Detection of Selection in Humans with SNPs Large-scale SNP-surveylooked at: • Because survey is snapshot of current frequencies, evidence for selection or drift is indirect • This is about bulk properties, not about individual genes 106 Genes in an average of 57 human individuals 60,410 base pairs of noncoding sequence (UTRs, introns, some promoters) 135,823 base pairs of coding sequence Some salient points: We will discuss only polymorphisms in coding sequence (cSNPs) Data from Cargill et al, Nature Genetics 1999 vol 22:231
But consider: Silent changes usually produce no phenotype and are therefore unlikely to be subject to selection -- neutral assumption holds Replacement changes can produce a phenotype, if only subtle or in synthetic combination -- neutral assumption may not hold Far more replacement changes are deleterious than advantageous Null Hypothesis for SNP Survey • In the average coding region, about 30% of possible point muts are silent • Silent substitutions – don’t change the aa • Replacement substitutions – do change the aa • conservative substitutions – a functionally similar aa • nonconservative substitutions – a functionally different aa If there had been no selection in population history, we would expect 70% of coding region polymorphisms to be replacement and 30% to be silent Source: A. Sidow, BIOSCI 203
2. Conservative replacements outnumber nonconservative replacements Total 185 185 Conservative 119 ~92 Nonconservative 66 ~93 Observed Expected if no selection Results of SNP Survey 1. Silent polymorphisms outnumber replacement polymorphisms Total 392 392 Silent 207 118 Replacement 185 274 Observed Expected if no selection • Implication: selection against deleterious mutations • penalizes replacements • especially penalizes nonconservative replacements Source: A. Sidow, BIOSCI 203
Overview • History • Some Population Genetics • origins of genetic variation • evolutionary timescales • selection and drift • neutral theory • Detection of Selection in Humans with SNPs • Some more Population Genetics • Migration • Wright’s FST • Inference of Human Phylogenetic Tree • Time to Most Recent Common Ancestor (TMRCA) • Unique Origin vs. Multiregional Evolution Models • Geographic Origin of Humans
Migration: another source of allele frequency change • In a subdivided population, drift and varied selection result in diversity among subpopulations • Migration limits genetic divergence • Lack of migration can allow speciation to occur • Only 1 migrant per generation is enough to keep drift partially in check (prevent complete fixation of alleles) !
Pop2 Pop3 Pop1 Pop4 C/C T/C T/C T/C T/C T/C T/C T/C T/C T/C T/C T/C T/C T/T T/T T/C T/T T/C T/C T/C T/C T/C T/C T/C T/C C/C CC T/C T/T T/T T/C T/C C/C T/T T/T T/T T/T T/T C/C C/C C/C CC C/C CC T/C T/T C/C T/T T/T T/T T/T C/C T/T T/T T/T T/T T/T T/T T/T T/T T/T T/T T/T T/T Allele frequencies and population history What are the allele frequencies vs. heterozygosities? Overdominant (balancing) selection (Heterozygote advantage) HW Expectation Population Subdivision Just a rare minor allele Source: A. Sidow, BIOSCI 203
Pop2 Pop3 T/T T/T T/T C/C T/C T/C T/C T/C T/C T/C T/C T/C CC C/C C/C T/T C/C C/C T/T T/T T/T CC T/T T/T T/T T/T C/C C/C C/C CC C/C T/T Maybe: Pop3a (Oahu) Pop3b (Kauai) Population Subdivision Wright’s F-statistics (FST, etc) are measures of genetic diversity Indicates population subdivision FST measures a reduction of average heterozygosity between the subpopulations and the total population. Source: A. Sidow, BIOSCI 203
Wright’s FST: a measure of genetic diversity among populations
Wright’s FST: a measure of genetic diversity among populations “Decrease of heterozygosity” FST = (HT-HS)/HT (0.2371 – 0.1424)/0.2371 = 0.3993 (indicates high overall diversity of subpopulations) 0 – 0.05: little genetic differentiation 0.05-0.15: moderate 0.15-0.25: great > 0.25: very great FSR = (HR-HS)/HR (0.1589 – 0.1424)/0.1589 = 0.1036 Variation among subpops within each region FRT = (HT-HR)/HT (0.2371 – 0.1589)/0.2371 = 0.3299 Variation among regions within total pop (greater than variation within regions – regions capture population structure)
Time to Most Recent Common Ancestor (TMRCA) • Archeological evidence • origin in Africa 50-100kya • spread to rest of world, 50-60kya • What does genetic evidence say? • What about the location?
Mitochondrial DNA • An organelle of the animal cell • Kreb’s Cycle (aerobic respiration) takes place here • Transmitted only along female lineage • Haploid genome, independent from human “host” • High mutation rate
Mitochondrial “Eve” • Most recent matrilineal common ancestor of all living humans • All our mitochondria are descended from hers • Does not mean she was the only human female alive at the time • Consider the set S of all humans alive today • Take the set S’ = mothers-of(S). (now all female) • Size(S’) ≤ Size (S) • ...continue until you have one member: that’s Eve • Members of S have other female ancestors, but Eve is the only one with an unbroken matrilineal line to all of S • She lived ~230kya • She was not Eve during her own lifetime • Title of Eve depends on current set of people alive • as matrilineal lines die out, you get a more recent Eve • Difficult to determine if she was Homo sapiens
Y-chromosome “Adam” • Part of the Y chromosome does not recombine • Hence we can do a similar trick • However, only men (XY) carry the Y chromosome • So we can only identify the most recent patrilineal common ancestor of all men living today: • Estimated to live ~100kya • never met “Eve”! • Why are mtDNA and Y chromosome TMRCA dates so different? • lower NE for males than for females? • polygyny more frequent than polyandry? • higher male mortality rates? • higher male variability in reproductive success? • patrilocal marriage more common than matrilocal? • mtDNA mutation rates variable, causing error?
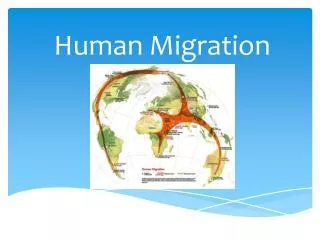
Tracking Human Migrations Current consensus: ~1,000 individuals (a tribe) left Africa 100kya...
Human microsatellite data - 1052 individuals; 52 populations; 377 autosomal microsatellite markers “microsatellite” or Short Tandem Repeat (STR) = 2-6 bases repeated several times e.g., TCTA TCTA TCTA TCTA TCTA TCTA TCTA TCTA - “indigenous populations” only; all individuals’ grandparents lived in same place Rosenberg et al.,Science298:2381-2385.
Unique Origin (UO) vs. Multiregion Evolution (ME) Models for Humans UO model had long been assumed, but never formally tested. Question is: where did most change between Homo erectus and Homo sapiens accumulate? time Genome Research 15:1161-1167
10 models tested Tested 9 Multiregion Evolution (ME) models, and one Unique Origin (UO) model
Validating their methods... • Used 5,000 runs as “pseudo-observed” data (half UO-generated, half ME-generated) • Used 5,000 runs as test data • Counted up how many times they could correctly distinguish UO- or ME-generated pseudo-observed data
FST versus distance in Humans Ramachandran et al.,PNAS102(44)
Geographic Origin of Humans - Pairwise distances used to imply an ordering - Assumes a single origin - Assumes no intermingling after a colony founded - A central African origin has the most explanatory power Ramachandran et al.,PNAS102(44)