Download
1 / 22
220 likes | 481 Views
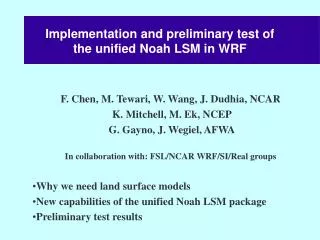
Verification of WRF-Noah Model Results for the Summer Experiment Using SURFRAD Data. Mukul Tewari, Fei Chen, Kevin Manning, Wei Wang, Jimy Dudhia(NCAR), Jerry Wegiel (AFWA). Outline: Objectives WRF Model Configuration Results June, July 2005 Summary. Objectives.

E N D
Verification of WRF-Noah Model Results for the Summer Experiment Using SURFRAD Data Mukul Tewari, Fei Chen, Kevin Manning, Wei Wang, Jimy Dudhia(NCAR), Jerry Wegiel (AFWA) • Outline: • Objectives • WRF Model Configuration • Results • June, July 2005 • Summary
Objectives • To verify very high resolution, very large domain WRF model results from summer experiment using SURFRAD (SURFace RADiation budget network) data • To evaluate long-term WRF surface radiation budgets and near surface variables verified over different landuse types • To test the real-time capability of HRLDAS which provided the soil data for the summer experiment
Surface Radiation Budget Network(SURFRAD) • Surface Radiation Budget Network (SURFRAD) was established in 1993 through the support of NOAA's Office of Global Programs • Its primary objective is to support climate research with accurate, continuous, long-term measurements of the surface radiation budget over the United States. • Seven SURFRAD stations are operating in climatologically diverse regions: Montana, Colorado, Illinois, Mississippi, Pennsylvania, Nevada and South Dakota • Possibly sensible and latent heat flux measurements will soon become an integral part of SURFRAD • http://www.srrb.noaa.gov
WRF-Model Configuration • Single domain (4km) • No of points E-W, N-S (971X741) • 35 Vertical levels • Model initialized at 00Z (integrated for 36 hrs) • Verification: • June, July 2005 (summer experiment) • Physics Options • YSU PBL • Noah LSM • RRTM radiation • Dudhia SW • WSM 6-class graupel MP
Landuse Map and Observations Sites Fort Peck,MT Penn State, PA Bondville, IL Boulder, CO Sioux, SD Bondville: Dryland Cropland (CAT2) Boulder: Cropland (CAT5) Fort Peck: Grassland/ Grassland (CAT7) Goodwin Creek: Cropland/ Woodland (CAT6) Penn State: Dryland Cropland (CAT2) Sioux: Dryland Cropland (CAT2) Goodwin Creek, MS
Observed Time Series SWDOWNJune 2005 Days 1-10 Days 21-30 Days 11-20 Bondville, IL Boulder, CO
Verification for a Clear Day at Bondville, IL24 July 2005 GSW SWDOWN Wind Speed GLW Red: Observed; Blue: Model
Verification for a Clear Day at Boulder, CO29 July 2005 GSW Red: Observed; Blue: Model SWDOWN Wind Speed GLW
Verification for a Cloudy Day at Bondville, IL27 July 2005 Red: Observed; Blue: Model SWDOWN GSW Wind Speed GLW
Verification for a Cloudy Day at Boulder, CO26 July 2005 Red: Observed; Blue: Model SWDOWN GSW Wind Speed GLW
Bias for all Stations (Clear Days) June 2005 GLW SWDOWN GSW Black: BON Red: TBL D Blue: FPK Green: GWN L Blue: PSU Purple: SXF WIND SPEED
Bias for All Stations (Cloudy Days) June 2005 SWDOWN GSW Black: BON Red: TBL D Blue: FPK Green: GWN L Blue: PSU Purple: SXF GLW
Probability Distribution Function (PDF) for Wind Speed (June and July 2005) July June
RMSE for all Stations (Clear Days) JUNE JULY Black: BON Red: TBL D Blue: FPK Green: GWN L Blue: PSU Purple: SXF SWDOWN GLW
RMSE for All Stations (Cloudy days) JUNE Black: BON Red: TBL D Blue: FPK Green: GWN L Blue: PSU Purple: SXF JULY SWDOWN GLW
RMSE for all Stations (Clear + Cloudy)June 2005 GSW Black: BON Red: TBL D Blue: FPK Green: GWN L Blue: PSU Purple: SXF SWDOWN GLW
Bias for all Stations (Clear + Cloudy) June 2005 GSW SWDOWN Black: BON Red: TBL D Blue: FPK Green: GWN L Blue: PSU Purple: SXF GLW
A Simple Approach for detection of cloudy events • Cloud detection was done using “DSW Baseline” defined separately for each station and each month. • First the Expected Clear Sky DSW (ECS-DSW) was determined for every 3-minute using all available DSW observations at a station during a month. ECS-DSW is defined as the average of top 20% DSW values at a given time. • ECS-DSW diurnal curve was smoothed using a low-pass filter. • DSW-Baseline was defined as 80% of ECS-DSW • Same DSW baseline was used for model as well as for stations.
Detection of Cloudy and Clear DaysJune 2005 Clear days Cloudy days
Landuse based Verification for 15 June 2005 2m Temperature Wind Speed RED: Dryland Cropland, Blue: Cropland, Black: Grassland Green: Shrubland, Yellow: EvergreenNeedleleaf Forest
Landuse based Verification for 15 June 2005 RH 2m Q RED: Dryland Cropland, Blue: Cropland, Black: Grassland Green: Shrubland, Yellow: EvergreenNeedleleaf Forest
Summary • WRF model radiation and near surface results are evaluated for summer experiment. The model shows good agreement for SW radiation with observations for clear days. • Model shows systematic positive bias in forenoon hours and negative bias during afternoon hours for clear days. • Cropland generally has lower bias in temperature among all the landuse categories used for verification. Grassland and Shrubland seems to contribute more toward bias in temperature. • More comprehensive verification is in process.