Download
1 / 24
240 likes | 405 Views
Application of Charge Manipulation Reactions to Improve Deconvolution Algorithm Output. David E. Erickson, Jian Liu, Scott A. McLuckey Purdue University, West Lafayette, IN. Introduction.

E N D
Application of Charge Manipulation Reactions to Improve Deconvolution Algorithm Output David E. Erickson, Jian Liu, Scott A. McLuckey Purdue University, West Lafayette, IN
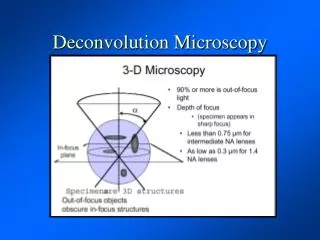
Introduction • Currently, there are several limitations of interpreting mass spectra with high mass and highly charged components such as: • Limited mass range • Limited mass resolution • Using the known tools of ion/ion reactions and deconvolution algorithms, it may be possible to develop procedures to overcome these limitations in order to simplify analysis. • This technique will combine the computational tool of deconvolution with the experimental ability to produce “keys” that the algorithm will look for. In this case, the “keys” are charge state series, which can be obtained through proton transfercharge reduction ion/ion reactions.
Ion/Ion Charge Manipulation • Knowing that a charge series may be used by a deconvolution algorithm to identify the zero-charge mass, ion/ion reactions may be employed to generate charge series. • Proton transfer ion/ion reactions have been used previously to identify complex mixtures by charge reducing the multiply charged species to the singly charged species1,2. • Charge reduction kinetics are well characterized and follows square of the charge state so high charge states will react faster to form lower charge states3. • A single multiply-charged ion of the analyte can be spread into several charge states after a sufficiently long exposure to proton-transfer reagents. v: relative velocity of the ionsμ: reduced mass of the ionsz1,z2: charges of the anions and cations, respectively
Deconvolution Algorithms Deconvolution(as used in mathematics) The inversion of a convolution equation; does not normally have unique solution. Nonlinear algorithms include the CLEAN algorithm, maximum entropy method (which is used in bayesian reconstruct in these experiments), LUCY, and others5. • Several parameters of a spectrum can be convoluted. In this case, deconvolution will be used to mean deconvolution of charge information in order to obtain the zero-charge mass. • Characteristics that are used in a deconvolution algorithm are things like: isotope spacing, peak position, charge series, and intensity. • Variable parameters in a deconvolution algorithm are things like: mass range, charge state range, step size, signal-to-noise, and minimum intensity.
ZeroCharge Deconvolution • The parameter varied most in the experimental acquisition of data is charge series. Charge series can be defined as a series of peaks representing the same mass but with consecutive charge states. For example, a charge series for 1000 could be 500,333,250,200.Each representing 1000 but divided by z = 2,3,4,5. • There are 3 steps to these algorithms • 1) Pick which peaks are appropriate to subject to the deconvolution algorithm • 2) Calculate possibilities (remember: deconvolution solutions are generally not unique) • 3) Characterize the confidence of the results
Experimental Scheme Mass Spectrum MS/MS (CID) Deconvoluted Mass Graph MS/MS + proton transfer (PT) Deconvoluted Mass Graph Comparedeconvolutedzero-charge spectrum toexperimentally obtainedsingly charged spectrum MS/MS + proton transfer (PT)to +1
Experimental • MS/MS Data was collected in a modified QSTAR instrument for mutual storage and dual-nanospray5. • MS/MS and charge manipulation experiments were performed using the following general sequence:1) ionize analyte cations → 2)isolate cations passing through Q1 → 3)store in Q2 → 4)perform in-trap collisional induced dissociation (CID) → 5)ionize proton transfer reagent anions → 6)isolate anions passing through Q1 → 7)mutually store cations and anions in Q2 → 8)pulse to time-of-flight • Positive samples were used without further purification and electrosprayed in ~5-20μM concentration in 49.5/49.5/1 (v/v/v) water/methanol/acetic acid • Negative proton transfer reagent anions were perfluoro-1-octanol (PFO) and were electrosprayed in ~200 μM concentration in 48/48/4 (v/v/v) water/methanol/ammonium hydroxide
Simulated Data Parameters • Data was simulated in MathCAD using a Gaussian peak shape to test the following properties: • Mass accuracy : Accuracy 0.5 Da and peak resolution was variable with Gaussian shape of σ=0.2. Accuracy was examined using +0.5 Da to reflect an extreme case of inaccuracy in TOF instruments, and reasonable performance in ion traps. • Signal-to-noise • Resolution : Resolution was maintained at σ=0.2 due to the previous characterization of the algorithm that only valued the peak position, not the resolution. Isotopic envelopes were not generated, and hence not available for inclusion into the algorithm as supporting information. • Charge state distribution size
Layout of Experiments • Use simulated data to determine which experimental parameters are most important. • Use simulated and experimental data to determine which of the algorithm parameters are important • Use experimental data to test the validity of this method.
Example of Simulated Spectrum of 10,000 Da molecule +2 zoom +2 +1 +3 High intensity Gaussiannoise spikes Relative Abundance Baseline noise
Simulation • After determining that the mass accuracy and sampling frequency were the primary determinants of the algorithm results, the experimental variable of charge state was tested. • Notes: • A minimum of 3 charge states are necessary in a series to determine a zero charge mass. • If the singly charged instance of a charge state was present in the charge series, it would not be included in the calculation.For example, if z=1,2,3,4, only z=2,3,4 would be used to determine the zero charge mass. In the case of z=1,2,3, since z=1 is not used, and z=2,3 only contains two values (<3) there will be no zero charge mass calculated. • If there is a charge state set that contains a subset of integer multiples, there is a chance that the subset will be considered as a series to calculate a zero charge mass.For example, if a series consists of z={8,7,6,5,4} there is a subset that is divisible by 2 that also would work: z={4,3.5,3,2.5,2}. That subset leads to a second zero charge mass that is a factor of 2 lower than the original zero charge mass
Simulation Results • Resolution – no effect on peak identification (isotope information was not used) • Mass accuracy and sampling frequency:determine the values to be used in the algorithm, the accuracy of the algorithm is determined by these two parameters • Noise – no influence in these experiments It seems that the first part of the algorithm, peak picking, is keying in on the peak position rather than the other characteristics of the peaks. This property makes the algorithm applicable to instruments that produce spectra with other properties, e.g. different peak shapes, different resolution.
Discussion of Deconvolution as a Function of Minimum Intensity • Deconvolution parameters, minimum intensity threshold and S/N, can effect the false positive and false negative rate. • By varying the minimum intensity threshold, different peaks would be allowed to be used in the deconvolution. Keeping the S/N at 3 requires the peak distinction from the noise even though the threshold is low. • The four spectra show the difference in the deconvolution of the same experimental spectrum as a function of the minimum intensity. • As shown in the table of intensity coverage, false positives can be reduced, but at the expense of adding some false negatives. • Generally, the decrease of false positives is greater than the increase of false negatives.
Intensity Coverage • In a hypothesis testing situation, it is common to use metrics such as: true positive, false positive, false negative, and true negative. These are generally reported in terms of fractions of absolute numbers. • Considering the case where there are peaks that differ in abundance, it may be appropriate to account for the intensities of the peaks.
Method of Calculating Intensity Coverage • Identify all of the peaks using an objective peak picker software • Sum the intensity of those picked peaks • Find the peaks that match, i.e. exist in both the experimental +1 and deconvoluted spectra • Sum the intensity of the matched peaks • Find the ratio between the intensities found in 2. and 4. False positive Calculated:Any extra peaks/intensity are false positives. False negative Experimental:Any peaks/intensity missing are false negatives.
Intensity Coverage of Deconvoluted Peaks False positive = 100% - x False negative = 100% - x
2000 2000 4000 4000 6000 6000 8000 8000 10000 10000 Spectrum Comparison for ubiqutin +8 MS/MS Zero-charge deconvoluted ubiqutin +8 MS/MS 170ms reaction time Zero-charge deconvoluted ubiqutin +8 MS/MS + PT 8000 ubiqutin +8 MS/MS + PT reduced to +1 720msreaction time 2000 4000 6000 8000
Ubiquitin +12 MS/MS Followed by Ion/Ion Reaction:Deconvolution as a Function of Minimum Intensity 2000 4000 6000 8000 10000 S/N:3, Minimum Intensity:1%False Positive: 11.47%False Negative: 52.35% S/N:3, Minimum Intensity:3%False Positive: 9.14%False Negative: 56.97% S/N:3, Minimum Intensity:6%False Positive: 5.94%False Negative: 58.19% S/N:3, Minimum Intensity:10%False Positive: 4.34%False Negative: 58.89%
Ubiquitin +12 MS/MS Followed by Ion/Ion Reactions:Comparison of Extents of Reaction 2000 4000 6000 8000 10000 Zero-charge deconvoluted ubiqutin +12 MS/MS Zero-charge deconvoluted ubiqutin +12 MS/MS & ion/ion reaction Zero-charge deconvoluted ubiqutin +12 MS/MS & longer ion/ion reaction ubiqutin +12 MS/MS + ion/ion reaction, reduced to +1
Ubiquitin +8 CID Deconvoluted Zero Charge Spectra Zero charge MS/MS deconvolution Ion/ion reaction MS/MS + PT Zero charge deconvolution
Discussion ofDeconvolution as a Function of Reaction Time • The difference in deconvoluted output between no reaction time and a small reaction time is large because of the high rate of reactivity on high charge states. • The difference between a long reaction time and an even longer reaction time is small because the lower charge state reacts much slower. However, it is advantageous to react sufficiently long to disperse the analyte ions over more of the mass range of your analyzing conditions. • A major consideration of longer reaction times is that the ions of the original ion population may now be dispersed among several ion populations. This will give a much lower abundance. If that problem is coupled with a mass or charge state bias, e.g. in high mass cases, quantitation could be especially difficult.
Conclusions • Charge reduction reactions along with tuned deconvolution parameters can positively impact deconvolution algorithms by: • increasing true positive results • decreasing false positive and false negative results.Generally these are maximized independently, or moderately improved together. • Even though the number of peaks in the spectrum increases, the ability to provide positive correlation among related peaks of the same mass seems to lead to the improved deconvolution performance. • This method works on samples where precursor ion charge states are high enough so that product ions can be reduced into a charge series > 3.
Acknowledgements • McLuckey group • National Institute of Health GM 45372
References • Stephenson, J.L., McLuckey, S.A., Ion/ion Proton Transfer Reactions for Protein Mixture Analysis. Analytical Chemistry, 1996. 68(22): p. 4026-4032. • Stephenson, J.L., McLuckey, S.A., Ion/ion Reactions in the Gas Phase: Proton Transfer Reactions Involving Multiply-Charged Proteins. Journal of the American Chemical Society, 1996. 118(31): p. 7390-7397. • McLuckey, S.A., Stephenson, J.L., Asano, K.G., Ion/ion Proton-Transfer Kinetics: Implications for Analysis of Ions Derived from Electrospray of Protein Mixtures. Analytical Chemistry, 1998. 70(6): p. 1198-1202. • Xia, Y., Chrisman, P.A., Erickson, D.E., Liu, J., Liang, X.R., Londry, F.A., Yang, M.J., McLuckey, S.A., Implementation of Ion/Ion Reactions in a Quadrupole/Time-of-Flight Tandem Mass Spectrometer. Analytical Chemistry, 2006. 78(12): p. 4146-4154. • Zhang, Z., Marshall, A.G., A Universal Algorithm for Fast and Automated Charge State Deconvolution of Electrospray Mass-to-Charge Ratio Spectra. Journal of the American Society for Mass Spectrometry, 1998. 9(3): p. 225-233.