Download
1 / 15
150 likes | 290 Views
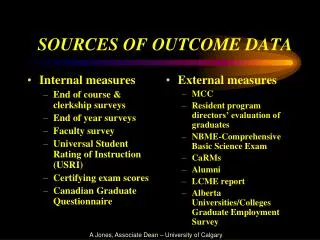
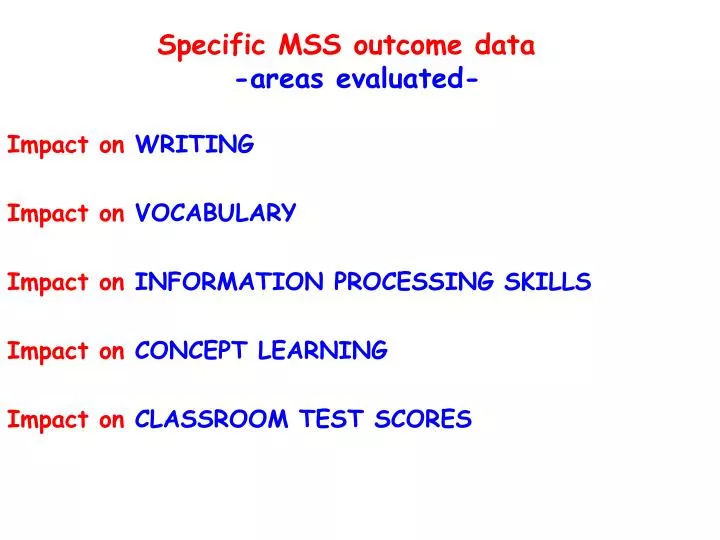
Specific MSS outcome data -areas evaluated-. Impact on WRITING. Impact on VOCABULARY. Impact on INFORMATION PROCESSING SKILLS. Impact on CONCEPT LEARNING. Impact on CLASSROOM TEST SCORES. Impact on composition writing of 8th grade students with learning disabilities.

E N D
Specific MSS outcome data -areas evaluated- Impact on WRITING Impact on VOCABULARY Impact on INFORMATION PROCESSING SKILLS Impact on CONCEPT LEARNING Impact on CLASSROOM TEST SCORES
Impact on composition writing of 8th grade students with learning disabilities N= 28 Students w/LD intervention group (gen.ed. classes} 28 Students w/LD control group (gen.ed. classes} 20 typical achieving students Dependent variables Fluency Pretest-Posttest Design Matched students in Control Group Typical –achievers used for descriptive purposes Idea Elaboration Mechanics Attitude
MSS students w/LD POST 126 words Typical 8th grader 117 words Typical 8th grader w/LD 29 words 24 words Non-MSS students w/LD POST Impact on composition writing of 8th grade students with learning disabilities FLUENCY +97 words more than pretest +9 words more than typical 8th grader 5 words less
Impact on composition writing of 8th grade students with learning disabilities IDEA elaboration Measure: Analysis of writing Cued main idea statements{use of transition words} Non-cued main idea statements{did not use transitions} # of supporting details RESULTS Performance of MSS students w/LD approximated that of typical achievers
Impact on composition writing of 8th grade students with learning disabilities Attitude @ Writing Measure: Self-report survey Typical students self-report some fear & considerable “avoidance” Typical students w/LD self-report high levels of both fear & avoidance MSS students w/LD RESULTS No change in avoidance, but marked reduction in fear & increase in empowerment indicators
Comparison school 1 43.79% 41.62% -2.17% Comparison school 2 35.55% 28.50% -7.05% 7th Grade Alabama Writing Assessment All students Hi-performing school 92.64% 85.08% -6.66% 2002-03 2003-04 Gains Makes Sense school 37.65% 60.51% 22.86%
Hi-performing school Hi-performing school 92.64% 64.00% 65.00% 85.08% 1% -6.66% Comparison school 1 Comparison school 1 19.35% 43.79% 15.56% 41.62% -2.17% -3.79% Comparison school 2 Comparison school 2 6.52% 35.55% 28.50% 3.13% -3.39% -7.05% Makes Sense school Makes Sense school 14.21% 37.65% 60.51% 20.00% 22.86% 5.79% Africian American students Hi-performing school NA NA NA Comparison school 1 34.69% 27.50% -7.19% Comparison school 2 35.55% 23.40% -10.07% Makes Sense school 27.08% 43.83% 20.75% SPE students 7th Grade Alabama Writing Assessment All students 2002-03 2003-04 Gains
Lower-performing schools definitely demonstrate the most dramatic improvements Lower-performing schools definitely demonstrate the most dramatic improvements 9 Schools Extremely low performance 8 Schools Low performance 7 Schools Moderate performance 2 Schools Good performance 82.68% ’04 MSS Impact of Makes Sense Strategies on 5th grade Alabama Writing Assessment ’04 MSS 74.81% ’03 73.02% ’04 MSS 62.41% ’03 58.39% ’04 MSS 49.24% Moderate-performing schools performing almost equal to Good-performing schools ’03 38.83% ’03 21.6% 27.67 pt. gain 23.08 pt. gain 15.67 pt. gain 9.79 pt. gain State-wide average = .05 pt. gain
Differentiating curriculum Making information more learnable Using brain-based pedagogy Action Research by SchoolsAlabama Writing Assessment % students meeting standards 2002-03 2003-04 Gains Rural 7th Grade 32.71% 57.84% 25.13% 61% 23% Suburb 7th Grade 38%
ALL students MSS school 20.00% 54.55% 34.55% MSS school #2 15.09% 63.63% 48.54% GE students 13.23% Non-MSS school 11.49% 24.72% - - MSS school 72.79% MSS school #2 20.00% 79.54% 59.54% Af.Am. students 14.23% Non-MSS school 7.99% 22.22% MSS school 20.00% 54.17% 34.17% MSS school #2 15.09% 63.63% 48.54% SPE students 0% Non-MSS school 0% 0% - - - MSS school MSS school #2 0% 10.00% 10.00% Urban 5th Grade MSS SchoolsMSS schools vs. pretest-matched Non-MSS school 12.56% Non-MSS school 9.01% 21.57% 2002-03 2003-04 Gains
Differentiating curriculum Making information more learnable Using brain-based pedagogy Makes Sense Strategies implementation English Language Learners / ESL California Writing Assessment % students meeting standards 2002-03 2003-04 Gains 24% 75% 51 pts Inner-city LAUSD Holms Middle School
Impact of think-sheets on 5th grade LD students’ information processing skills Before After 0 4.0 Main Ideas Details 2.4 12 Ability to identify main ideas and details of subject-area lesson
84% 85% 87% 96% 54% PRE POST PRE POST 84% PRE POST Control group of 6th grade typical achievers not receiving MSS Experimental group of 6th grade typical achievers receiving MSS Experimental group of 6th grade students w/LD receiving MSS 33 pt gain Impact on vocabulary test scores 6th grade inclusion class 12 pt gain
Differentiating curriculum Making information more learnable Using brain-based pedagogy Full-inclusion using a co-planning (NOT co-teaching) SPE model Concept test scores of students with LD Before After Gains High Soc Economic 6th grade 65% 14 pts 79% 30 pts 92% Mid Soc Economic 4/5th grade 62% 30 pts 93% 63% Low Soc Economic 4/5th grade
98% 81% 71% 97% PRE PRE POST POST 11th grade students w/LD 11TH grade typical achievers Impact on concept test scores11th grade inclusion social studies class 26 pt gain 17 pt gain