Download
1 / 53
570 likes | 891 Views
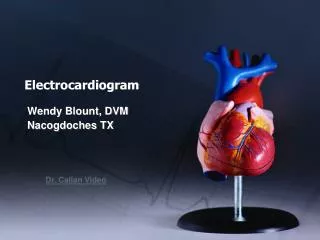
Electrocardiogram. Wendy Blount, DVM Nacogdoches TX. ECG – What it Detects. Heart chamber enlargement Eccentric hypertrophy Dilation and growth of heart chambers Due to volume overload Concentric hypertrophy Wall thickening of heart chambers Due to pressure overload

E N D
Electrocardiogram Wendy Blount, DVM Nacogdoches TX
ECG – What it Detects Heart chamber enlargement • Eccentric hypertrophy • Dilation and growth of heart chambers • Due to volume overload • Concentric hypertrophy • Wall thickening of heart chambers • Due to pressure overload Conduction Disturbances
ECG – What Doesn’t Detect Type of Heart chamber enlargement • Eccentric vs. Concentric hypertrophy • Congestive Heart Failure A Short ECG won’t detect many arrhythmias • Arrhythmias can be intermittent • 10 minutes is <1% of the day
ECG – When to Do • Pulse deficits detected on exam • Chaotic heart sounds (arrhythmia) detected on exam • Tachycardia • Bradycardia • Episodes of weakness or collapse • Pre-anesthetic in sick or geriatric animal • Abdominal mass (especially spleen) • Heart murmur
ECG – When to Do Event Recorders • Owner/witness starts recording during an event Holter Monitors • Continuously record ECG for 24 hours • Can rent for Dr. Kate Meurs at Washington State Vet School http://www.vetmed.wsu.edu/deptsVCGL/holter/requestform.aspx
ECG – Helpful Hints • Always in right lateral recumbency • Patient on a towel or rubber mat • Metal tables are more problematic • Limbs perpendicular to body • Place leads at the elbow and knee • No one moves while the ECG is being recorded • Enhance lead contact with gel or alcohol Alcohol is FLAMMABLE!!
ECG – Helpful Hints Which lead goes where • “Snow and Grass are on the ground” • White and green leads are on the bottom (R) • “Christmas comes at the end of the year” • Red and green are on the back legs • “Read the newspaper with your hands” • White and black are on front legs White – RF Green – RR (ground) Black – LF Red – LR
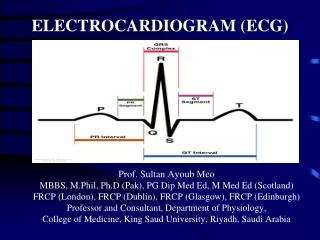
ECG – The Cardiac Cycle P wave • SA node fires • Atrial depolarization (contraction) • HS4 2. Iternodal tracts (shortcut to AV node)
ECG – The Cardiac Cycle PR interval • Beginning of P wave to beginning of QRS • AV node • *most of the PR interval is here* • Bundle of HIS • bundle branches (R&L) • Purkinje fiber network
ECG – The Cardiac Cycle QRS complex • ventricular depolarization (systole) • Q wave 1st negative deflection • R wave 1st positive deflection • S wave 2nd negative deflection
ECG – The Cardiac Cycle QRS complex • HS1 • AV valves closing • beginning of QRS • HS2 • Semilunar valves closing (AoV, PV) • end of QRS • Pulse is generated
ECG – The Cardiac Cycle T wave • Ventricular repolarization (diastole) • HS3 • Ventricular filling • if myocardium is stiff
ECG – The Cardiac Cycle QT interval • beginning of QRS to end of T wave • ventricular depolari- zation & repolarization • HS1, HS2, HS3 • Pulse generated
ECG – The Cardiac Cycle ST segment • Between S & T waves • Between ventricular contraction (depolarization – systole) and ventricular relaxation (repolarization – diastole) • Isn’t measured per se • But it’s relationship with baseline is noted
ECG – 6 Leads Bipolar leads • I – LF+ RF- • II – LR+ RF- • III – RR+ LF- Unipolar leads • aVR – RF+ (summation lead III)- • aVL – LF+ (summation lead II)- • aVF - LR+ (summation lead I)-
ECG – Systematic Interpretation • Heart Rate and Rhythm • Measurements of the parts • P wave - width and height • PR interval - length • QRS - width and height • QT interval – length • ST segment – relative to PR interval • T wave - width and height • Mean Electrical Axis Form
ECG – Measurements • Take 3-5 measurements and average • All measurements done in lead II • Use calipers • Measure from the center of the line
ECG – Heart Rate At 25 mm/sec, 150mm = 6 sec • “Bic Pen Times Ten” • Accurate within 10 beats per minute At 50 mm/sec, 300mm = 6 sec • A Bic Pen times Twenty • Accurate within 20 beats per minute
ECG – Heart Rate Normals • Giant dogs 60-140 Med-Lg dogs 70-160 • Toy dogs 80-180 Puppies 70-220 • Cats 100-240 Get Baseline heart rates for individuals on every visit
ECG – Rhythm Normal Sinus rhythm • Regular heart rate • Measure from one P wave to the next with calipers • P, QRS and T waves in each complex Respiratory Sinus Arrhythmia • heart rate regularly irregular • Speeds up with inhale, slows with exhale (vagal tone variance, in a regular cycle) • P, QRS and T waves in each complex • Variable P wave – wandering pacemaker • Heart rate less than 200 Arrhythmia
ECG – Rhythm Respiratory Sinus Arrhythmia
ECG – P Wave Measurements • Atrial depolarization (contraction) • Normal Dog: <0.4 mV x <0.04 sec <0.5 sec in giant breeds • 4 boxes tall • 25 mm/sec 1-1.25 boxes wide • 50 mm/sec 2-2.5 boxes wide • Normal Cat: <0.2 mV x <0.04 sec • 2 boxes tall
ECG – P Wave Measurements • Wide P wave (Sometimes Notched) • 25 mm/sec > 1 box wide • 50 mm/sec > 2 boxes wide • LA enlargement • Tall P wave (often spiked) • Dog > 4 boxes tall, cat > 2 boxes tall • RA enlargement • Variable P wave – normal variation • “wandering pacemaker” – increased vagal tone • Lack of P wave • Atrial standstill
ECG – P Wave Measurements Wandering pacemaker
ECG – PR Interval Conduction from atria to ventricles (AV node) Establishes the ECG baseline Normal Dog: 0.06-0.13 sec Normal Cat: 0.05-0.09 sec
ECG – PR Interval Conduction from atria to ventricles (AV node) Establishes the ECG baseline Normal Dog: 0.06-0.13 sec Normal Cat: 0.05-0.09 sec
ECG – PR Interval • Short PR Interval (tachycardia) • AV node is bypassed • “Accessory pathway” (Wolff-Parkinson-White) • Congenital or acquired • Treated in people by radioablation of the pathway • Sudden onset of tachycardia in a dog • Can try calcium channel blockers • Diltiazem SR (Plumb dose) • If you don’t treat right away, the myocardium will poop out & rapidly progressive CHF will ensue
ECG – PR Interval Normal Dog: 0.06-0.13 sec Normal Cat: 0.05-0.09 sec • Long PR Interval • Slow conduction through abnormal AV node • AV Blocks
ECG – PR Interval Normal Dog: 0.06-0.13 sec Normal Cat: 0.05-0.09 sec 1st degree AV Block • Every P wave is followed by a QRS • Due to increased vagal tone • Non-pathogenic 50 mm/sec
ECG – PR Interval 2nd degree AV Block Some P waves not followed by a QRS • Mobitz type I – PR progressively longer until QRS dropped (Wenkebach Phenomenon)
ECG – PR Interval 2nd degree AV Block Some P waves not followed by a QRS • Mobitz type 2 – no pattern • PR interval does not change • P-P interval is consistent, so SA node is working fine • PR interval may be prolonged and may be normal • Occasionally, a P wave is not followed by a QRS • Not necessarily pathogenic
Physiology - Cardiac Pacemakers Automatic cells in the heart • Depolarize on their own during phase 4 of the cardiac cycle • Rate of depolarization affected by autonomic nervous system • SA node (60-180 beats/min dog) (100-240 cat) • AV node (40-60 beats/min dog) (80-130 cat) • Purkinje fibers (20-40 beats/min) • Bundle of HIS (20-40 beats/min) • Ventricular myocytes (20-40 beats/min)
Physiology - Cardiac Pacemakers Automatic cells in the heart • The fastest functioning pacemaker in the heart takes over, by default • The closer to the AV node, the more the escape beat will resemble normal QRS • The closer to the ventricle, the more wide and bizarre the QRS will appear • Escape rhythm – pacemaker other than SA node takes over, because SA node fails to fire
ECG – PR Interval 3rd degree AV Block (complete AV block) No relationship between P waves and QRS • P waves have their own rate (faster), determined by the normal SA node • QRS has its own rate (slower), determined by the automaticity of the fastest remaining functioning pacemaker • Treatment • pacemaker • Prognosis • Cats – without anesthesia, potentially very good • Dogs – eventual asystole is likely, if no pacemaker implanted
ECG – PR Interval 3rd degree AV Block (complete AV block) • Pacemaker above bifurcation of bundle of His • Pacemaker left ventricle
ECG – QRS Complex Measurements Normal Dog: <40 lbs: <0.05sec x <3.0 mV • 30 boxes tall • 25 mm/sec 1.25 boxes wide • 50 mm/sec 2.5 boxes wide >40 lbs: <0.06sec x <3.0 mV • 25 mm/ sec 1.5 boxes wide • 50 mm/sec 3 boxes wide Normal Cat: <0.04sec x <0.9 mV • 9 boxes tall • 25 mm/sec 1 box wide • 50 mm/sec 2 boxes wide
ECG – QRS Complex Measurements R wave measured from baseline to top • Tall R wave, wide QRS • LV enlargement • Left Bundle branch block • Deep S wave in leads I, II & III • RV enlargement
ECG – Bundle Branch Blocks • Depolarization wave through myocardium rather than through Purkinje network on affected side • takes longer • “appears bigger” on ECG • Can be persistent or intermittent • Intermittent often precipitated by increased heart rate (delayed refractory period) • Left side, right side or both • Bilateral BBB looks like 3rd degree AV block
ECG – Bundle Branch Blocks Right Bundle Branch Block (RBBB) • Causes: • primary conduction system disease • Disruption of moderator band • RV enlargement • Congenital (especially beagles) • ECG • Deep S wave leads I, II, III, aVF • Wide QRS • May cause a split S2
ECG – Bundle Branch Blocks Left Bundle Branch Block (RBBB) • Causes: • primary conduction system disease • Widespread LV myocardial disease • Unlike RBBB, not usually benign • ECG • Tall R wave • Wide QRS • Looks like a VPC, but follows normal PR interval
Ventricular Premature Complexes • Depolarization wave through myocardium rather than through Purkinje network on affected side • takes longer • “appears bigger” on ECG
Ventricular Premature Complexes • VPCs are like escape beats in that they both originate from the ventricular myocardium • VPCs are abnormal due to primary LV pathology or secondary to metabolic disease • Escape beats are the normal life saving response to a failure of upline pacemaker • VPCs can be persistent or intermittent • Intermittent often precipitated by increased heart rate (delayed refractory period) • Multiform VPCs are more serious • Multifocal areas of LV pathology
ECG – ST Segment ST segment depression or elevation • >0.2mV between baseline and ST • hypothermia • hypokalemia • Digitalis toxicity • Bundle branch block • Myocardial infarction • Rare in dogs • Can be seen in feline HCM
ECG – Mean Electrical Axis (MEA) • when a wavefront spreads toward an electrode, the largest possible deflection will occur • When a wavefront spreads perpendicular to a lead, the smallest or no deflection occurs • ECG shows the sum of all wavefronts relative to the lead being used to measure (MEA) • Isoelectric lead • lead with the smallest deflection • Perpendicular to the MEA
ECG – Mean Electrical Axis (MEA) • The normal MEA is 40o to 100o in the dog • Lead II is most perpendicular to the normal MEA • largest deflections • best for measurements • aVL is most often the isoelectric lead • Approximates MEA in normal dogs
ECG – Mean Electrical Axis (MEA) Calculating MEA by graph • Calculate the net deflection in lead I • Graph on “x axis” • Calculate net deflection in head aVF • Graph on “y axis” • Draw the vector between the two (MEA)
ECG – Mean Electrical Axis (MEA) +3 - 5 = -2 +10 -1.5 = +8.5 - + MEA = 105o
ECG – Mean Electrical Axis (MEA) Estimating MEA • Find the isoelectric lead • NOT the lead with smallest deflections • Lead with smallest NET DEFLECTION • MEA is perpendicular to that, in the direction of net deflection