Download
1 / 35
350 likes | 481 Views
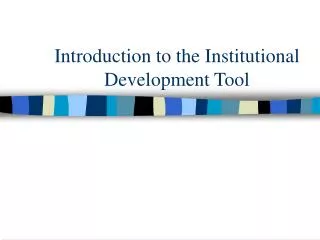
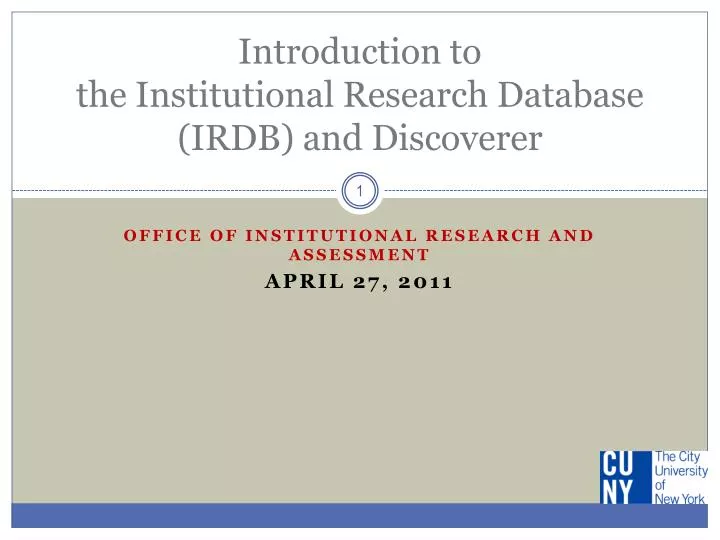
Introduction to the Institutional Research Database (IRDB) and Discoverer. Office of Institutional Research and Assessment April 27, 2011. Today’s Agenda. Introductions Housekeeping Data Sources IRDB Structures Tables/Fields Facts/Dimensions Discoverer Folders/Items

E N D
Introduction to the Institutional Research Database (IRDB) and Discoverer Office of Institutional Research and Assessment April 27, 2011
Today’s Agenda • Introductions • Housekeeping • Data Sources • IRDB Structures • Tables/Fields • Facts/Dimensions • Discoverer • Folders/Items • Rows, Columns, Page Items • Calculations • Documentation
How are data moved from operational systems into a data warehouse? • Step 1. Snapshots are extracted from operational systems. • Step 2. Extracted files are reformatted and cleaned. • Step 3. Pre-processed files are loaded into staging tables and metadata are loaded into lookup tables in an Oracle relational database. • Step 4. Data in the staging tables are migrated to normalized tables. • Step 5. Summary tables and other high performance query structures are created from the normalized tables and lookup tables. • Step 6. Semester-based fact and dimension tables are created from the normalized tables and lookup tables. • Step 7. Longitudinal fact tables are created from the semester-based fact and dimension tables.
Graduation File Survey data with SSN’s Post Graduate Surveys Skills Tests Results Performance File Clean Performance File Show- Registration File Clean Graduation File Clean Show-Reg File Steps 1–3Why are snapshots used to populate the IRDB? Extraction Transformation Load SIMS SHOW_FILE SQL*Loader COBOL SPSS PERF_FILE SQL*Loader COBOL SPSS GRAD_FILE SQL*Loader SKAT SKAT_FILE_02 SQL*Loader NCS Pearsons SPSS SQL*Loader VTEA_SURVEY_FILE_02 NYSED_PPROGRAM_LOOKUP Academic Program Inventory Database Link Database View
CUNY IRDBData Flow Diagram SPSS for Windows Extract Files CAS (freshman admissions) Oracle Discoverer Crosstabs ASTA (transfer admissions) Normalize Data (PL/SQL) Migrate Data into Oracle9i Environment (SQL*Loader) Joins from Multiple Tables across Multiple Terms SKAT (skills tests) Oracle Discoverer Tables SHOW (enrollment) Standardized Files Create Fact and Dimension Tables (SQL) Ad-Hoc Queries Ad-Hoc Queries PERF (grades) Oracle Discoverer Crosstabs Reformat and Clean Input Files (SPSS) Migrate Data into Oracle 9i Environment (SQL*Loader) GRAD (degrees) Group by Selected Columns (SQL) NCES (job survey) CUNY Data Book on Institutional Research Web Site Type or Cut and Paste Oracle Forms SFA (financial aid) Crystal Reports and Oracle Portal Special Reports Clearinghouse (transfers to non-CUNY colleges) Longitudinal Cohorts (denormalized student-level data) Institutional Researchers Staging Tables Operational Data Store (normalized student-level data) Spread sheets Data Warehhouse (denormalized student-level data) PC Files Lookup Tables (metadata) University Administrators Summary Tables (denormalized aggregate-level data) Code Descriptions from File Layouts Flash Enrollment Public Users
What are fact and dimension tables and how are they related? • A fact table is composed of numerical measures of business performance. Examples of facts would be headcount, FTE’s, and cumulative credits earned. • Dimension tables contain items that describe or categorize the items in the fact table. Examples of dimensions would be gender, full-time/part-time status, and college of attendance. • The fact table also contains foreign keys that can be used to join it with the primary keys of the dimension tables. For example, “Student ID”, “Term Enrolled Date”, and “College ID” are used to join the table “History Facts” with the table “History Major 1 Dim”. • A central fact table with multiple dimension tables radiating out from it is called a star schema.
What are the advantages of using a star schema? • Creates a database design that improves performance. • Parallels, in the database design, how the end users usually think and use the data. • Provides versatile and robust ad-hoc query capabilities. • Provides an extensible design which supports changing business requirements. • Can be used with point-and-click tools such as Oracle Discoverer 9iAs.
The Joins between the Fact Table “History Facts” and its Dimension Tables Are Defined by an OIRA Administrator in the Discoverer End-User Layer
IRASI Institutional Research Staten Island How is a campus limited to viewing only the data of its own students? IR.HISTORY_FACTS # student_id # term_enrolled_date # college_id IRASI.HISTORY_FACTS # student_id # term_enrolled_date # college_id IR.SEC_COLLEGE_07_MV # sec_student_id IR.USERID_LOOKUP # userid # college_id # table_name # table_grant
Users Select “Items” from a “Folder”with a Mouse Rather than Writing and Executing SQL Code
Discoverer • IRDB End-User Query Tool • Currently accessed via Citrix • Requires user id/password – domain log in (managed by CIS) • Discoverer (account required – managed by OIRA) • Set of Business Areas (linked fact and dimension tables) • History Facts – Historical Enrollment Records • Degree Facts - Historical Degree Records (through most recent complete academic year) • Cohort Facts – Integration of Enrollment and Degree data in a longitudinal structure for tracking cohorts over time • Special Business Area - mostly stand-alone tables for specific analyses (e.g., PMP)
Users Arrange the Items as the Page-Breaks, Columns, and Rows for a Desired Report
Accessing the IRDB Through Discoverer • Navigate your web browser to https://ez.cuny.edu • Log in with your LAN user id and password • Click on the Discoverer icon in the list of available applications via Citrix • Install Java code as prompted upon first use of a given computer (you may need an IT technician to install programs on your computer) • After Java installation, you will be prompted to log in to Discoverer (user id and initial password established by OIRA) • Documentation available
Creating a New Workbook as a Crosstabs Reportwith Discoverer 9iAS
The Derived Fact “Headcount” Reflects the Business Rules for Excluding Some Students from Official Enrollment Statistics
A Crosstab Built from “History Facts” andTwo Related Dimension Tables
Creating a New Workbook as a Table Report (or Extract) using Discoverer
A Table Report of Fall 2002 Graduates with the Original Dimension “Birth Date”, the Computed Fact “Age”, and the Computed Dimension “Age Group 1”
With Discoverer, Table Reports Can Be Exported in a Variety of Formats
Tracking Student Progress:How Should Many-to-Many Relationships between Fact Tables be Resolved? History Facts Degree Facts
Answer: Create an Intersection Entity that Has Many-to-One Relationships with both Tables History Facts Intersection Entity Degree Facts
Selecting Three Different “Headcount” Facts from the Table “Cohort Facts”
“Headcount” of Undergraduates Who Entered in Fall 1990“Headcount” of Fall 1990 Entrants Who Returned in Fall 1991“Headcount” of Fall 1990 Entrants Who Graduated by Summer 1996
The “Headcount” Facts in the Table Cohort Facts” and the Foreign Keys that Join it with the Table “Degree Facts” Can Be Used to Create a Graduation Rate Item
Six- Year Graduation Rates of Fall 1990 Undergraduate Entrants