Download
1 / 24
240 likes | 439 Views
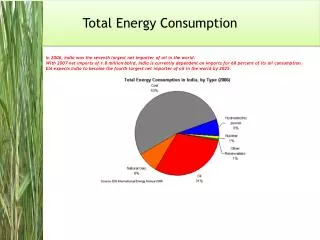
FIGURE - 1. TOTAL ENERGY SCHEMES. A scheme in which the total energy requirements of the plant in the form of POWER and HEAT are produced from a supply of PRIMARY FUEL and in which the energy wastage is reduced to a minimum.

E N D
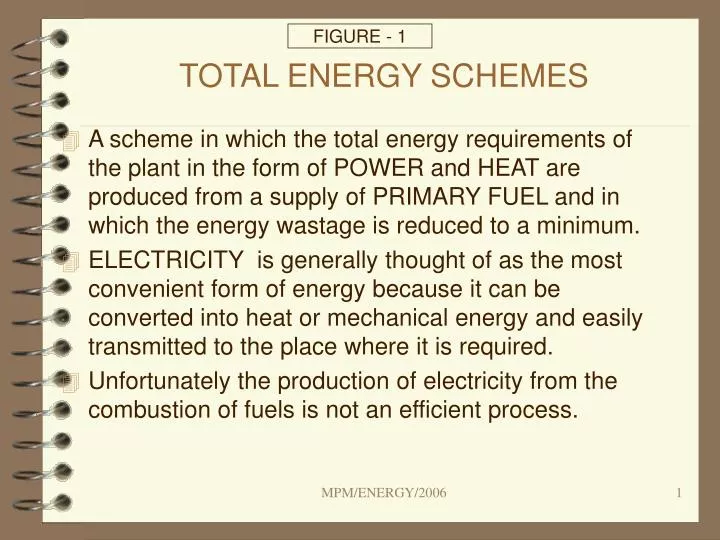
FIGURE - 1 TOTAL ENERGY SCHEMES • A scheme in which the total energy requirements of the plant in the form of POWER and HEAT are produced from a supply of PRIMARY FUEL and in which the energy wastage is reduced to a minimum. • ELECTRICITY is generally thought of as the most convenient form of energy because it can be converted into heat or mechanical energy and easily transmitted to the place where it is required. • Unfortunately the production of electricity from the combustion of fuels is not an efficient process. MPM/ENERGY/2006
NON-RENEWABLE: Fossil fuels like coal,lignite etc Natural gas Oil. Nuclear energy. RENEWABLE: Hydroelectric schemes. Solar radiation. Wind energy. Wave energy. Tidal energy. Crop and wood residue. Animal waste. etc FIGURE - 2 ENERGY SOURCES MPM/ENERGY/2006
FIGURE - 3 ENERGY CONVERSION SYSTEMS CHEMICAL (FUEL) GEOTHERMAL NUCLEAR THERMAL HYDRO WIND WAVES TIDAL SOLAR MECHANICAL ELECTRICAL MPM/ENERGY/2006
FIGURE - 4 ENERGY CONVERSION EFFICIENCIES CHEMICAL (FUEL) 70 - 95 % THERMAL ENERGY 20 - 40% 100% MECHANICAL ELECTRICAL 90 - 95% 85 - 95% MPM/ENERGY/2006
FIGURE - 5 ENERGY CONVERSION EFFICIENCIES (contd.) EFFICIENCY [CARNOT] = {1 - T2/T1} Where: T1 is max temperature available[metallurgical limit] T2 is lowest temperature available[cooling water for condenser] Assuming max temperature as 1500 deg K and Cooling water temperature as 280 deg K Max cycle efficiency = [1 - 280/1500] x 100 = 81.3% Due to thehigh degree of irreversibility in the various process, then the cycle efficiencies in practice vary much lower than CARNOT EFFICIENCIES as below: POWER PLANTTYPECYCLE EFFICIENCY Steam Turbine38.00% (coal or nuclear fuel) Gas Turbine23.00% Diesel Engine41.00% MPM/ENERGY/2006
ANNEXURE - I ENERGY IN PAPER INDUSTRY Electricity - kWh/t of paper = 1300 Steam - t/t of paper = 9.00 CASE - I Purchased electricity from grid & thermal energy self generation Plant input 1300kWh/t or 1300x860 =1.347 MkCal/t 1000000 PU plant input 3.849 MkCal/t Public Utility 35.00% T&D 83.00% 1500x585+7500x576 = 5.198 MkCal/t 1000000 Plant input for steam 6.498 MkCal/t Boiler 80.00% Overall efficiency [6.545/10.347]x100 = 63.25% MPM/ENERGY/2006
ANNEXURE - II ENERGY IN PAPER INDUSTRY Electricity - kWh/t of paper = 1300 Steam - t/t of paper = 9.00 CASE - II Total energy system [co-generation] [1300x860 +1500x585+7500x576] 1000000 = 6.316 MkCal/t Total Plant input 8.311 MkCal/t Boiler 80.00% TG 95.00% Overall efficiency [6.316/8.311]x100 = 76.00% Energy reduction 10.347 - 8.311 = 2.036 MkCal/t or equivalent coal of 4000 GCV 2.036x1000000 = 509 kg/t 4000 MPM/ENERGY/2006
EFFICIENCY OF ENERGY SYSTEMS A. PUBLIC UTILITY STATION - 30 to 35 % B.TRANSMISSION & DISTRIBUTION. • Step-up station - 99.5% • EHV transmission - 99.0% • HV transmission - 97.5% • Sub transmission - 96.0% • Distribution station - 99.5% • Primary distribution - 95.0% • Overall T&D efficiency = [99.5x99.0x97.5x96.0x99.5x95.0] = 83.0% C.END USER PREMISES: • End user distribution - 95.0% • Motor efficiency - 90.0% • Driven equipment efficiency - 70.0% • End user premises overall efficiency -[95.0x90.0x70.0] = 59.85% D.ENERGY SYSTEM EFFICIENCY: Gen. Eff x T&D Effx End user Eff Overall energy system efficiency =(35.0x83.0x59.85] = 17.39 % MPM/ENERGY/2006 FIGURE - 1
GRAPH - 1 BOILER PRESSURE,TEMPERATURE VIS-A -VIS ENTHALPY OF STEAM MPM/ENERGY/2006
GRAPH - 2 Boiler pressure,Steam temperature vis-à-vis specific steam consumption by extraction @3.0ata &160 degC. kg/kWh @ 95.0% TG efficiency MPM/ENERGY/2006
GRAPH - 3 Boiler pressure,Steam temperature vis-à-vis specific steam consumption by condensing @0.12ata &49 degC. kg/kWh @ 95.0% TG efficiency MPM/ENERGY/2006
CAPTIVE POWER GENERATION & PURCHASED POWER in million kWh MPM/ENERGY/2006 GRAPH-P1
COST OFCAPTIVE POWER & PURCHASED POWER in Paise/kWh MPM/ENERGY/2006 GRAPH-P2
FIGURE - S1 HOW ENERGY IS UTILISED in EXTRACTION METHOD OF POWER GENERATION from each kg of STEAM. • 12.82% • For power output • 67.69% • For process. • 19.49% Return to boilers as hot condensate through DM plant. MPM/ENERGY/2006
FIGURE - S2 HOW ENERGY UTILISED in CONDENSING METHOD OF POWER GENERATION from each kg of STEAM. • 19.62 % • For power output • 71.54 % • To atmosphere through Cooling Tower. • 8.85 % • Return to boilers as hot condensate. MPM/ENERGY/2006
FIGURE - S3 THERMAL ENERGY INPUT TO STEAM IN BOILERS 450^0C 64ata 680 kCal/kg 283^0C 69ata Heat of Evaporation or Latent Heat 363 kCal/kg Super Heat 117 kCal/kg Sensible Heat 198kCal/kg 100^0C 1ata Enthalpy 780kCal/kg MPM/ENERGY/2006
FIGURE - S4 THERMAL ENERGY USED IN TURBINE FROM MP STEAM 450^0C 63ata Process Heat 472kCal/kg 260^0C 13ata Super Heat 54 kCal/kg Heat of Evaporation or Latent Heat 472 kCal/kg 194 kCal/kg 100^0C 1ata Enthalpy 726 kCal/kg MPM/ENERGY/2006
FIGURE - S5 THERMAL ENERGY USED IN TURBINE FROM LP STEAM 450^0C 63ata Process Heat 503kCal/kg 200^0C 5ata Super Heat 100 kCal/kg Heat of Evaporation or Latent Heat 503 kCal/kg 154 kCal/kg 100^0C 1ata Enthalpy 680 kCal/kg MPM/ENERGY/2006
FIGURE - S6 THERMAL ENERGY USED IN TURBINE FROM CONDENSING STEAM 450^0C 63ata Heat lost in condensers to atmosphere through Cooling Towers Super Heat 160 kCal/kg Heat of Evaporation or Latent Heat 560 kCal/kg 60 kCal/kg 60^0C 0.20ata Enthalpy 623 kCal/kg MPM/ENERGY/2006
FIGURE - S7 MPM/ENERGY/2006
FIGURE - S8 MPM/ENERGY/2006
FIGURE - S9 MPM/ENERGY/2006
FIGURE - S10 MPM/ENERGY/2006
DATA - C1 MPM/ENERGY/2006