Download
1 / 1
30 likes | 202 Views
Incorporating Local Weather and Soil Variation in Adaptive Nitrogen Management: Validating the Adapt-N Tool for On-Farm Sidedress Recommendations. Bianca N. Moebius-Clune * , Harold M. van Es, Jeff M. Melkonian, Art DeGaetano , Laura Joseph, Robert R. Schindelbeck, Shannon Gomes

E N D
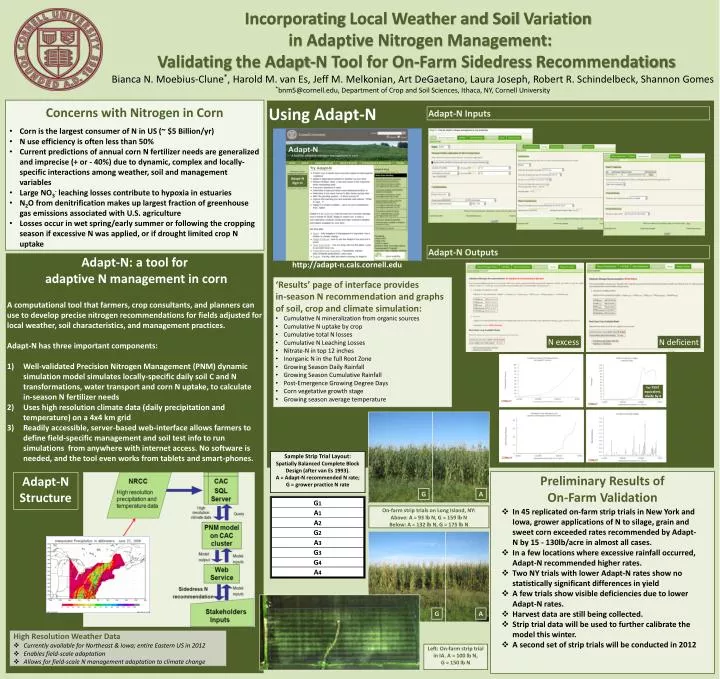
Incorporating Local Weather and Soil Variation in Adaptive Nitrogen Management: Validating the Adapt-N Tool for On-Farm Sidedress Recommendations Bianca N. Moebius-Clune*, Harold M. van Es, Jeff M. Melkonian, Art DeGaetano, Laura Joseph, Robert R. Schindelbeck, Shannon Gomes *bnm5@cornell.edu, Department of Crop and Soil Sciences, Ithaca, NY, Cornell University Using Adapt-N • Concerns with Nitrogen in Corn • Corn is the largest consumer of N in US (~ $5 Billion/yr) • N use efficiency is often less than 50% • Current predictions of annual corn N fertilizer needs are generalized and imprecise (+ or - 40%) due to dynamic, complex and locally-specific interactions among weather, soil and management variables • Large NO3-leaching losses contribute to hypoxia in estuaries • N2O from denitrification makes up largest fraction of greenhouse gas emissions associated with U.S. agriculture • Losses occur in wet spring/early summer or following the cropping season if excessive N was applied, or if drought limited crop N uptake Adapt-N Inputs Adapt-N Outputs Adapt-N: a tool for adaptive N management in corn A computational tool that farmers, crop consultants, and planners can use to develop precise nitrogen recommendations for fields adjusted for local weather, soil characteristics, and management practices. Adapt-N has three important components: Well-validated Precision Nitrogen Management (PNM) dynamic simulation model simulates locally-specific daily soil C and N transformations, water transport and corn N uptake, to calculate in-season N fertilizer needs Uses high resolution climate data (daily precipitation and temperature) on a 4x4 km grid Readily accessible, server-based web-interface allows farmers to define field-specific management and soil test info to run simulations from anywhere with internet access. No software is needed, and the tool even works from tablets and smart-phones. http://adapt-n.cals.cornell.edu • ‘Results’ page of interface provides • in-season N recommendation and graphs of soil, crop and climate simulation: • Cumulative N mineralization from organic sources • Cumulative N uptake by crop • Cumulative total N losses • Cumulative N Leaching Losses • Nitrate-N in top 12 inches • Inorganic N in the full Root Zone • Growing Season Daily Rainfall • Growing Season Cumulative Rainfall • Post-Emergence Growing Degree Days • Corn vegetative growth stage • Growing season average temperature N excess N deficient for PSNT equivalent, divide by 4 Sample Strip Trial Layout: Spatially Balanced Complete Block Design (after van Es 1993). A = Adapt-N recommended N rate; G = grower practice N rate Preliminary Results of On-Farm Validation Adapt-N Structure G A • In 45 replicated on-farm strip trials in New York and Iowa, grower applications of N to silage, grain and sweet corn exceeded rates recommended by Adapt-N by 15 - 130lb/acrein almost all cases. • In a few locations where excessive rainfall occurred, Adapt-N recommended higher rates. • Two NY trials with lower Adapt-N rates show no statistically significant differences in yield • A few trials show visible deficiencies due to lower Adapt-N rates. • Harvest data are still being collected. • Strip trial data will be used to further calibrate the model this winter. • A second set of strip trials will be conducted in 2012 On-farm strip trials on Long Island, NY: Above: A = 93 lb N, G = 159 lb N Below: A = 132 lb N, G = 175 lb N G A • High Resolution Weather Data • Currently available for Northeast & Iowa; entire Eastern US in 2012 • Enables field-scale adaptation • Allows for field-scale N management adaptation to climate change Left: On-farm strip trial in IA. A = 100 lb N, G = 150 lb N