Download
1 / 17
540 likes | 1.43k Views
C hapter 1 Pseudocode & Flowcharts. 1 st Semester 2014/2015. Levels of Program Development. Define the problem. Human thought Plan the problem solution. writing the algorithm [pseudo-natural language (English, Arabic) or drawing the flowchart diagram).

E N D
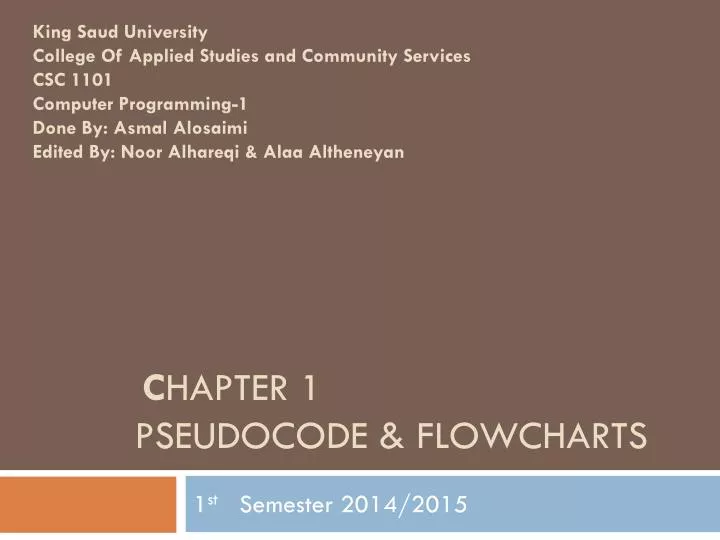
King Saud University College Of Applied Studies and Community Services CSC 1101Computer Programming-1 Done By: AsmalAlosaimi Edited By: NoorAlhareqi & Alaa Altheneyan Chapter 1Pseudocode & Flowcharts 1st Semester 2014/2015
Levels of Program Development • Define the problem. Human thought • Plan the problem solution. writing the algorithm [pseudo-natural language (English, Arabic) or drawing the flowchart diagram). • Code the program. High Level Programming Language (C, C++, Java, …) • Compile the program. Machine Code • Run the program. • Test and debug the program. AsmaAlosaimi
From Lec1 we learn that • When planning for a problem solution, algorithms are used to outline the solution steps using • English like statements, called pseudocode. or • A flowchart , which is a graphical representation of an algorithm. Asma Alosaimi
Pseudocode • Pseudocode is a detailed description of what a computer program must do, expressed in an English like language rather than in a programming language. Asma Alosaimi
Pseudocode Example • Write a Program to Print the Sum of two integer Numbers • Start the program • Read the first number and save in the variable ( N1 ) • Read the second number and save in the variable ( N2 ) • Sum the both numbers and save the result in the variable ( Sum ) Sum = N1 + N2 • Print the variable ( Sum ) • End the program Asma Alosaimi
Flowchart • A flowchart is a type of diagram that represents an algorithm , showing the steps as boxes of various kinds [ex: rectangles, diamonds, ovals], and their order by connecting these with arrows. Asma Alosaimi
Flowcharts Symbols Start End Print n1 Read n1 N2 = n1+3 N2 = 5 n1 > 3
Solution start Draw a flowchart for a program that calculates and print the area and the perimeter of a rectangle. • Input • Length • width • Processing • Area = length*width • Perimeter = 2*( length + width) • Output • Area • Perimeter Read L, W area = L * W perimeter = 2 (L+W) Print area Print perimeter End Asma Alosaimi
Example 2 • Draw the flow chart for a program that calculates the total salary for an employee using this equation: Total_Sal = Salary +Overtime AsmaAlosaimi
Solution start • Input • Salary • Overtime • Processing • Total_Sal = Salary +Overtime • Output • Total_Sal Read Salary Read Overtime • Total_Sal = • Salary +Overtime Print Total_Sal End Asma Alosaimi
Example 3 • Draw a flowchart for a program that determine if the temperature degree is above or below freezing. • Input • Temp. • Processing • Check if Temp is below the 32 below freezing. • Check if Temp is above the 32 above freezing. • Output • Print “below freezing” or “above freezing” Asma Alosaimi
Solution Asma Alosaimi
Example 4 • Draw a flowchart for a program that calculates the Zakat, where the user enter the amount of money then the program show the zakat. • Zakat =(2.5/100) * amount. • Zakat is not calculated if the amount is less than 1000 S.R Asma Alosaimi
Solution • Input • amount. • Processing • Check if amount is below 1000 Zakat =0. • Check if amount is above 1000 Zakat =(2.5/100) * amount • Output • Zakat Asma Alosaimi
Solution Start Read amount yes Amount > 1000 no Zakat=0. Zakat=(2.5/100)*amount Print Zakat Asma Alosaimi End
Example 5 • Draw a flowchart to find the sum of first 50 natural numbers. • 1+2+3+ ….. +50 Asma Alosaimi