Download
1 / 1
10 likes | 117 Views
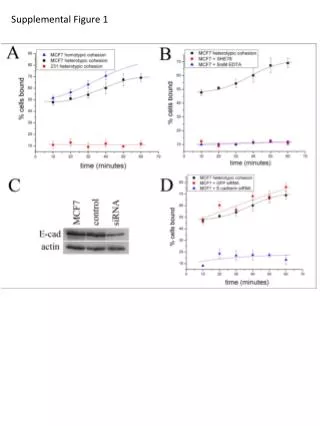
Supplemental Figure 1. B. A. g H2AX. TRF1. Merge. 100. Untreated. 80. 60. % of TIFs positive cells. 40. RHPS4. 20. 0. _. RHPS4. siTRF2. siPOT1. CPT. IR. siTRF2. siPOT1. CPT. IR.

E N D
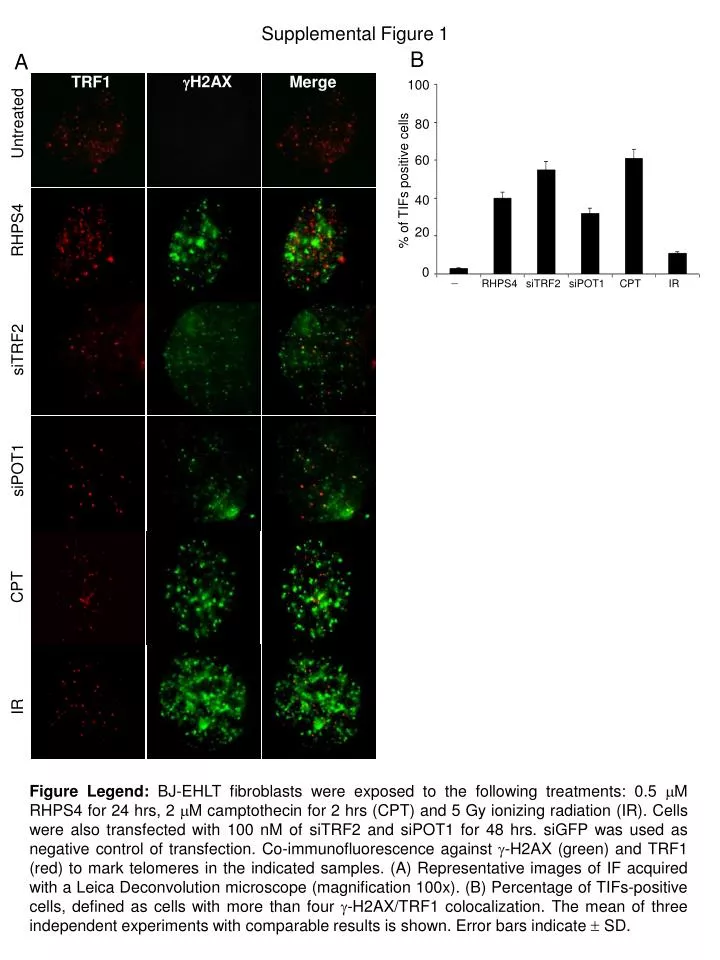
Supplemental Figure 1 B A gH2AX TRF1 Merge 100 Untreated 80 60 % of TIFs positive cells 40 RHPS4 20 0 _ RHPS4 siTRF2 siPOT1 CPT IR siTRF2 siPOT1 CPT IR Figure Legend: BJ-EHLT fibroblasts were exposed to the following treatments: 0.5 M RHPS4 for 24 hrs, 2 M camptothecin for 2 hrs (CPT) and 5 Gy ionizing radiation (IR). Cells were also transfected with 100 nM of siTRF2 and siPOT1 for 48 hrs. siGFP was used as negative control of transfection. Co-immunofluorescence against -H2AX (green) and TRF1 (red) to mark telomeres in the indicated samples. (A) Representative images of IF acquired with a Leica Deconvolution microscope (magnification 100x). (B) Percentage of TIFs-positive cells, defined as cells with more than four -H2AX/TRF1 colocalization. The mean of three independent experiments with comparable results is shown. Error bars indicate SD.