Download
1 / 28
280 likes | 458 Views
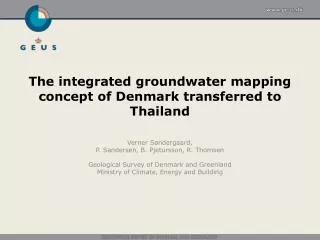
Large Scale Mapping of Groundwater Resources Using a Highly Integrated Set of Tools. Verner H. Søndergaard Geological Survey of Denmark and Greenland, Denmark Esben Auken Department of Earth Sciences, University of Aarhus, Denmark Anders V. Christiansen

E N D
Large Scale Mapping of Groundwater Resources Using a Highly Integrated Set of Tools Verner H. Søndergaard Geological Survey of Denmark and Greenland, Denmark Esben Auken Department of Earth Sciences, University of Aarhus, Denmark Anders V. Christiansen Geological Survey of Denmark and Greenland, Denmark
Outline • Introduction • Large scale groundwater mapping concept • An integrated geophysical data management system • Summary
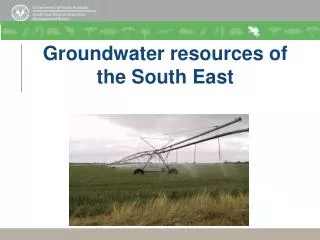
Introduction • Denmark: 5.5 mill. inhabitants • Area: 43.000 km2 • 2/3 is farmland • Water supply is decentralized • Drinking water is ~ 99% groundwater • No complex treatment • Abstraction: ~ 800 mill. m3/year
Introduction • National strategy for groundwater mapping initiated in 1999 • Mapping program expected to end in 2015 • Financed by water consumers paying extra 4 cents per m3 of water • The Danish Ministry of Environment is responsible for the groundwater mapping project. (15 mill. Euro/year!)
Introduction Particular value-able areas for drinking water interests, OSD (40% ~17.400 km2 of the area of Denmark) That is where the mapping is carried out
Groundwater mapping • Major aspects of the national project: • Mapping aquifers, vulnerability and groundwater quality • Establishing geological and hydro geological models • Pointing out groundwater protection areas and establishing plans for future water supply
Groundwater mapping About the mapping project (with special emphasis on the geophysical part): • Characteristic types of aquifers in Denmark • Advantages by combining spatially dense geophysical data with information from existing and new investigation boreholes
Profile Groundwater mapping • Aquifers in sand and limestone sediments • Tertiary and quaternary sediments Incised (buried) valleys in the next cases Profile
Different mapping methods The new SkyTEM-method, 25-35 m above ground level TEM-method (40x40), ground-based DC-measurements, here the pulled array PACES-method The reflection seismic method DC-measurements, the multi-electrode sounding method Drilling
Mapping aquifers (TEM) Level of the good conductor in this area ranges from 200m below sea level to 100 m above sea level. Limestone TEM-mapping reveals a complex system of incised valleys – potential aquifer locations. The good conductor is the lower boundary for aquifers in the area (either tertiary clay or saline groundwater) Aarhus Level of the (lowest) good conductor based on TEM-measurements Map area: 50 x 60 km.
Mapping aquifers (TEM) Level of the good conductor in this area ranges from 200m below sea level to 100 m above sea level. Limestone TEM-mapping reveals a complex system of incised valleys – potential aquifer locations. The good conductor is the lower boundary for aquifers in the area (either tertiary clay or saline groundwater) Aarhus Level of the (lowest) good conductor based on TEM-measurements Map area: 50 x 60 km. Example of new boreholes from this area on the next slide
Mapping aquifers (TEM and boreholes) (275 km2) Level of the (lowest) good conductor based on TEM-soundings; boreholes > 100m deep (black) The 2 boreholes carried out in the incised valley structure reveal thick (up to 80 metres) sand sediments perfect for water abstraction (red colours on borehole profiles). The incised valley here is ~ 0,5 km wide.
Mapping aquifers (TEM and boreholes) (275 km2) Level of the (lowest) good conductor based on TEM-soundings; boreholes > 100m deep (black) Boreholes > 50m deep but without the new boreholes > 100m deep
The necessity of dense data and large mapping areas in heterogeneous regions Mapping incised valleys with the TEM-method Small TEM-mapping areas of a few km2 (surface of the good conductor)
Groundwater mapping Important conditions for the mapping project: • Cooperation between participants about open standards and guidelines for measurements as well as for interpretations and data storage • Advantages of an integrated system to handle and use the huge amount of geophysical data collected by different consultant companies with different instruments and at different times
Groundwater mapping • A Cooperation between the HydroGeophysics Group at the University of Aarhus, the Danish Ministry of the Environment and the Geological Survey of Denmark and Greenland (GEUS) since 1999 has resulted in: • Standards and guidelines for geophysical measurements and data interpretations • A national test-site for all TEM-instruments in use • Further developments concerning instruments (SkyTEM) and interpretation software systems (Aarhus Workbench) • Further education of all participating geophysicists and geologists at the authorities and the consulting companies • All geophysical data and interpretations are stored in a national database GERDA, where anybody can get data for free!
TEM and SkyTEM measurements TEM-data Data are collected by ground based systems since 1990 Data are collected by the airborne SkyTEM-method since 2003 TEM data cover ~ 12,000 km2 Collected until Oct. 2009
DC measurements DC-Data: PACES VES Collected until Oct. 2009
Geophysical data overview All methods: TEM/SkyTEM PACES VES SEISMICS Collected until Oct. 2009
Geophysical data overview & OSD All methods: TEM/SkyTEM PACES VES SEISMICS Collected until Oct. 2009
Integrated system for management of data Aarhus Workbench Program package for • Data processing and inversion of resistivity and electromagnetic data • Preparation of database for upload to GERDA • Visualization of data and models in themes on maps in themes on profiles • Data quality control • Advanced data analysis • Advanced data interpretation with mutual inversion of different data types and borehole a priori information Aarhus Workbench illustrates a theme of TEM data: The depth of a good conductor (12 ohmm) Aarhus
Integrated system for management of data Aarhus Workbench Program package for • Data processing and inversion of resistivity and electromagnetic data • Preparation of database for upload to GERDA • Visualization of data and models in themes on maps in themes on profiles • Data quality control • Advanced data analysis • Advanced data interpretation with mutual inversion of different data types and borehole a priori information
Integrated system for management of data Due to open standards, guidelines and the integrated data handling system : Geophysical data from a large number of mapping projects can be combined seamless without problems
Level of the a good conductor based on TEM-measurements – with 83.000 data points! Integrated system for management of data Limestone Aarhus Level of the a good conductor based on TEM-measurements Map area: 50 x 60 km. Map showing the many separate mapping projects (94!) in this area Map showing 5 different types of TEM-mapping instruments having been used in the area
Summary • In heterogeneous regions data density must be high to provide acceptable mapping results • The mapped areas should be of a considerable size in heterogeneous regions • Geophysical methods like TEM/SkyTEM and DC-methods can provide sufficient data densities • Geophysical measurements combined with detailed borehole information provide results, that meet the requirements of detailed hydro geological models.
Summary • An integrated data handling system makes it possible to merge geophysics - carried out during longer periods - by different companies - with different instruments which is of great value for future reprocessing, mapping and administrative purposes • Open standards, guidelines, detailed databases, education and cooperation are major criteria in order to be able to accomplish a projectwith many participants