Download
1 / 29
290 likes | 302 Views
Learn about the factors that influence climate and the six major climate zones found throughout the world. Explore how temperature, precipitation, and other weather conditions vary based on latitude, altitude, distance from the sea, and prevailing winds. Discover the unique characteristics of equatorial, arid, Mediterranean, polar, snow, and temperate climates.

E N D
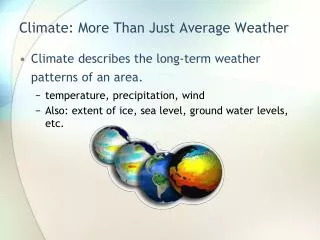
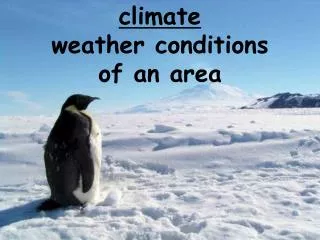
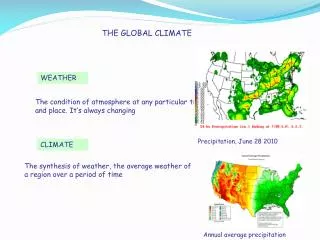
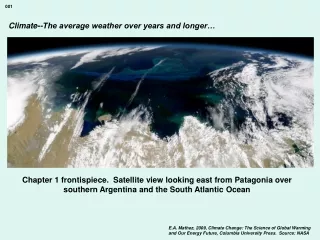
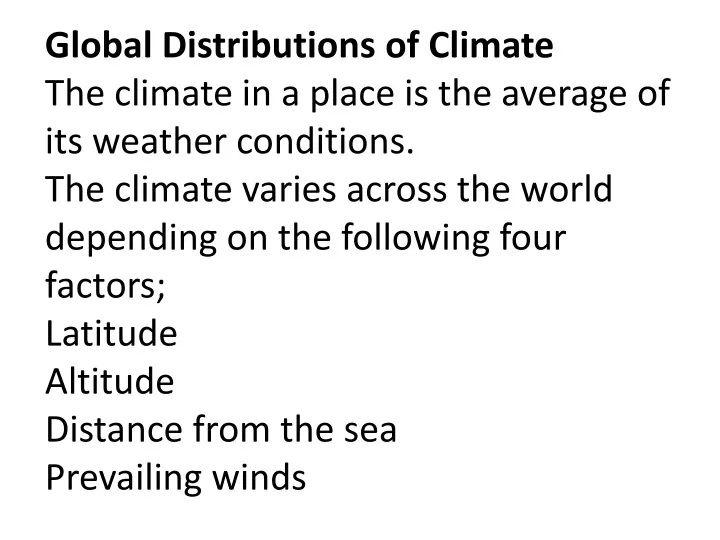
Global Distributions of Climate The climate in a place is the average of its weather conditions. The climate varies across the world depending on the following four factors; Latitude Altitude Distance from the sea Prevailing winds
Latitude The closer an area is to the equator, the hotter the area will be. This is because the direct rays from the sun are concentrated along the equator. Altitude Temperature decreases the higher we travel into the atmosphere. The higher a place is above the sea level, the colder it is likely to be. Distance from the sea In the summer, the sea heats up less quickly than the land so places further inland will have hotter summers. In the winter, the sea heats up more quickly than the land so people on the coast will have warmer winters. Prevailing winds If the wind blows from the direction of the equator, then it is likely to be warm. If the wind blows from either of the poles then it is likely to be cold.
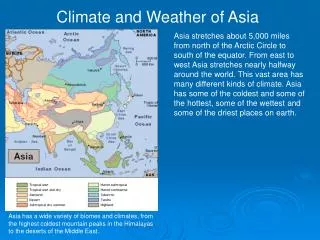
Climate Zones There are six major climate zones located throughout the world. Equatorial Lying between the Tropic of Cancer in the Northern Hemisphere and the Tropic of Capricorn in the south, equatorial climates are home to most of the world’s rainforests where rainfall and humidity are high. Temperatures are not that extreme — generally 25 to 35 °C — with not much variation through the year. Arid Deserts are found mainly across the subtropical continents. Here, descending air forms large, almost permanent, areas of high pressure leading to cloud-free skies virtually all year round. Annual rainfall is low and, in some deserts, almost non-existent. Because they’re so dry, the temperature range in deserts is huge, regularly exceeding 45 °C by day in summer and often falling to below freezing overnight in winter. Mediterranean The hot, dry summers of the Mediterranean, South Africa and southern Australia are caused by a seasonal shift of the descending air that also creates our deserts. Low summer rainfall is matched by many months of warm, sunny weather. But, at times, dangerously hot spells of weather engulf these regions with fiercely high temperatures of up to 45 °C. In winter, there is more rain and cooler temperatures, but little frost. This classification covers a range of climates from Mediterranean-type climates and humid, subtropical zones to maritime climates influenced by the oceans —
Snow In the higher northern latitudes, the vast forests of fir and spruce (often called the taiga) and the featureless tundra endure long, hard winters with short, bountiful summers, separated by rapid seasonal changes during spring and autumn. In the northernmost regions, the land is permanently frozen and will not thaw even during the brief summer. Polar The Arctic is mostly frozen ocean, and while its climate is moderated by the relatively warm waters of the Atlantic Ocean, winter temperatures can still fall to below -30 °C. Antarctica is a vast continent of mountains and high plateaux buried under more than 3 km of ice. Temperatures below -80 °C have been recorded and the Antarctic i nterior is very dry — drier than many deserts. This is because as the temperature falls so does the atmosphere’s capacity to hold water vapour needed to make snow. Temperate This classification covers a range of climates from Mediterranean-type climates and humid, subtropical zones to maritime climates influenced by the oceans — like ours in the UK. The UK has a typical maritime climate, where temperatures are quite moderate although hot summer days and cold winter nights still occur. Summers in maritime climates can be hot, warm or cool. In the UK we have what’s considered to be a warm summer, whereas in Iceland the season is classified as cool.
How to measure weather? • Meteorological Stations collect many different types of data. • Specific instruments are used to collect this information
Types of Data • Temperature (°C) • Daily Maximum and Minimum Temperature (°C) • Pressure (mb – millibar) • Wind direction • Wind Speed (km/h) • Rainfall (mm) • Relative humidity (%)
Data Collection • Stevenson Screen • A device that contains instruments that record certain weather data • Technical details: • Double louvered sides for air circulation • 1,25m above ground • Double roof, air insulates against sun • Painted white, to reflect sun / heat • Located in open space, to reduce interfrerence form buildings / trees • Door opens north in northern hemisphere / south in southern hemisphere to avoid sun shining on instruments
Inside a Stevenson Screen • Minimum / Maximum Thermometer • Wet / Dry bulb thermometer • Barometer
Maxi / Min Thermometer • Filled with Mercury or Alcohol • U-shaped capillary tube, min side bulb filled with liquid, other with vacuum • 2 separate temperature readings • Steel markers show temperature (can be reset by magnet) • Heating expansion • Cooling contraction • Use: recoding of daily temperature maxima
Wet / Dry Bulb Thermometer • Aka: Hygrometers • 1 normal thermometer • 1 wet thermometer • Wet one shows temperature at 100% humidity • Use: The difference between dry and wet temperature can be used to calculate relative humidity
Barometer • Measures atmospheric pressure • Average: 1013,25 mb • Mercury Barometer: • Changes in air pressure push mercury up the tube • Aneroid Barometer: • Changing pressure causes expansion and contraction of vacuum container
Rain Gauge • Collects water to determine how much rain falls • Collection either daily or hourly • Location: • Located away from buildings to reduce shelter effect • Top must be 30cm from ground to avoid splatter from ground • Base sunk into ground to avoid tripping • Needs collecting funnel • Narrow opening to avoid loss through evaporation
Wind vanes • Wind vanes • Show wind direction • Results can shown on a circular graph (wind rose)
Anemometers • Record the speed of wind • Speed is recoded in km/h or knots • 1knot = 1,852km/h • 10knots = 1 barb • Location • In the open • On a high pole
Cloud Cover • Measures how much of the sky is covered by clouds • Measurement in Oktas • 1 Okta = 1/8th of the sky = 12,5% of the sky
Cloud types • Alto = high • Cirrus = lock of hair • Cumulus = heap • Nimbus = precipitation bearing • Stratus = layer
Cloud types • High level: • Cirrus: above 6000m, composed of ice crystals • Mid level: • Altostratus: formation due to rising air, condensation, can bring rain/snow • Low level: • Nimbostratus: dark grey, brings persistant rain & low visibility, formless cloud layer • Stratocumulus: large, lumpy layered clouds, produce rain / drizzle • Stratus: continuous horizontal layer and level base, can produce drizzle • Cumulus: puffy small clouds, fai weather clouds • Cumulonimbus: large, dense and very tall, invovled in thunderstorms and intense weather
Clouds … Cirrus Cumulus Altostratus Nimbostratus Stratocumulus Stratus Cumulonimbus mammatus
Summary: Meteorological Data • Stevenson Screen • Contains: Min / Max thtermometer, Wet / Dry bulb thermometer, Barometer • Measures: Daily Min and Maximum temperature, Data for Relative humidity collection, atmospheric pressure • Open space observation • Rain gauge: measures daily or hourly rainfall • Wind vane: measures wind direction • Anemometer: measures wind speed • Cloud cover: measures the amount of clouds, records type of cloud
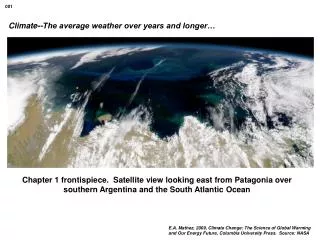
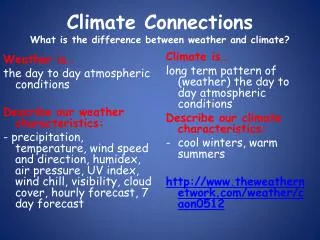
Weather is... the day to day condition of the air around us over a short period of time.
Temperature • Temperature means how hot or cold it is • It is usually measured with a thermometer in degrees centigrade(ºC)
Pressure • Pressure is a measure of how heavy the air is. • Pressure is measured with a barometer in millibars (mb)
Cloud Cover • Cloud Cover tells us how much of the sky is covered by clouds. • It is measured by estimating the amount of cloud cover in eighths.
Wind Speed • Wind speed is how fast the wind is blowing. • An anemometer measures wind speed in mph. • The most common type looks like a toy windmill. Three cups are fixed to a central shaft and the stronger the wind blows the faster they spin around. The wind speed is shown on a dial, just like a car's speedometer
Wind Direction • Wind direction is where the wind is blowing from. • Wind Vane/Wind Sock: measures wind direction by pointing towards North, East, South or West
Rainfall/Precipitation • Precipitation is water falling from the sky. • Rain gauge: measures the amount of rainfall in mm. Not only does a rain gauge measure rainfall, but also all other forms of precipitation.
Sunshine • Sunshine is light and warmth from the sun. • A Campbell Stokes Recorder measures sunshine. • This type of recorder is made up of a glass ball which concentrates sunshine on to a thick piece of card. The sunshine then burns a mark on the card which shows the number of hours of sunshine in the day.
Visibility • Visibility is how far ahead we can see. • It is measured using a tape measure or trundle wheel, in metres or kilometres.