Download
1 / 19
190 likes | 342 Views
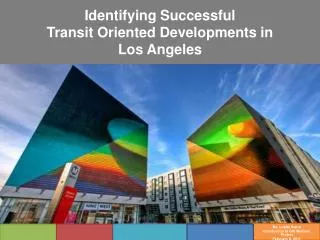
Transit-Oriented Development in Los Angeles County. By Jennifer Tolentino Fall 2010. Elements of a Successful TOD. Mixed land uses Incorporation of both residential and commercial zones in order to maximize proximity to services and amenities. Limited parking

E N D
Transit-Oriented Developmentin Los Angeles County By Jennifer Tolentino Fall 2010
Elements of a Successful TOD • Mixed land uses • Incorporation of both residential and commercial zones in order to maximize proximity to services and amenities. • Limited parking • Requiring a maximum parking restriction verses a minimum reduces the cost of development and increases incentives for transit usage. • Increased transit ridership • TOD is often linked to further development of the transit line. Therefore increasing ridership through TOD can create a positive feedback cycle for both TOD along the line, and the transit itself. • Surrounding area should be “human scaled” • Area should be pedestrian and bike friendly, with viable means of transport once riders arrive at station, e.g. effective bus transfers. • High Density • For a TOD is be successful along all of the aforementioned criteria, it must be developed in high density areas.
Challenges for TOD in LA County • Not all areas of LA have the necessary density. • The current transit system may not be well-enough established. • Unclear if Angelinos are willing to pay higher rents to live near transit. • Standard land appraisal methodology show LA TODs in some areas to have a prohibitive amount of risk for financing. Pictured: Del Mar Station TOD in Pasadena, currently only 2/3 occupied
Occupancy Rates • All of LA County
Recommendations • Transit-oriented development can be successful in Los Angeles County, but it needs to be assessed on multiple dimensions. • TOD should be focuses in areas that have the highest number of existing attributes which will contribute to a successful TOD. • When assessing the possibility of building a TOD, a more comprehensive look at the area along the transit line should be considered. • Taking into consideration access to amenities further down the line rather than merely looking at ½ radius around the station.
For Further Research • Given Census 2000 data was used, it will be more useful to look at TODs in these dimensions but with more current information. • Look into the current willingness-to-pay for those who currently reside in TODs. • Has ridership increased with TODs in Los Angeles, if so, how much? • Is LA County willing to reduce the number of parking spaces required for TOD in order to promote transit use over vehicles?
Skills Used • Slide 4: Inset, 7 Layers. • Slide 5: Use of original data: “MTA TODs”, created through geocoding and information from MTA. See Metadata slide. • Slide 6: Measurement Analysis Buffer. Created ½ mile radius around transit stops to determine how many retail centers fell into “walk-able area”. • Slide 7: Aggregated attribute fields: combined 11 ethnic household groups defined as having “no vehicle” into one variable “no vehicle”. Displayed variable using Dot Density. • Slide 8: Created Index: New variable “occupied housing rate” was created by: occupied units / total housing units. • Slide 11: Created Index: combined 20-49 units housing complexes and 50+ to create new variable “high density housing”. • Slide 13: Hotspot Analysis: created raster files using model (see slide), reclassified, created variable for “distance to transit station”. Gave 2x as much weight to proximity to transit stations in calculation. • Slide 14: Hotspot Analysis: used same raster data, but left “distance to transit station” out of calculation.