Download
1 / 4
70 likes | 470 Views
Intro to Topographic Maps: maps that show the elevation of the land above (or below) sea level. This is an example map, and the outermost ring will be labeled as 150 feet above sea level. Each line changes elevation by 25 feet. What is the elevation at point 1?

E N D
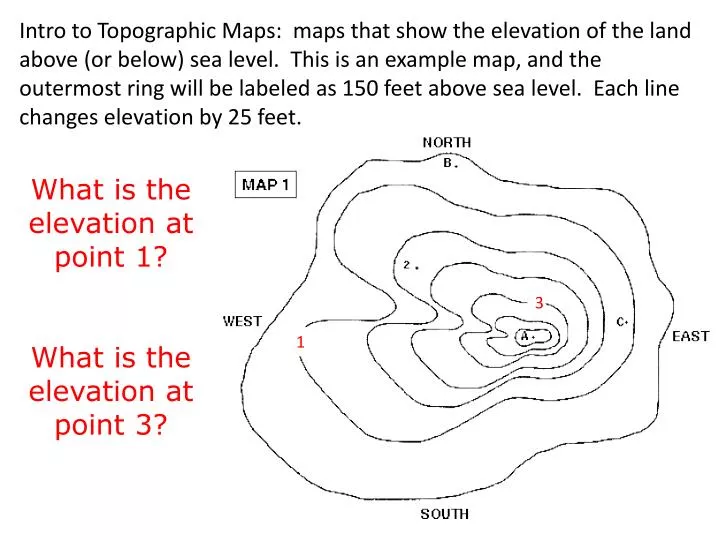
Intro to Topographic Maps: maps that show the elevation of the land above (or below) sea level. This is an example map, and the outermost ring will be labeled as 150 feet above sea level. Each line changes elevation by 25 feet. What is the elevation at point 1? What is the elevation at point 3? 3 1
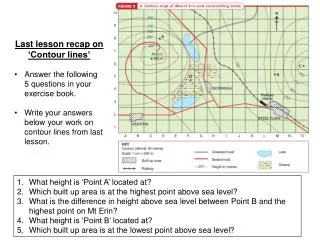
Find the biggest distance between 2 lines… Do you see these marked with the dotted blue? Since the lines are so far apart, the elevation is changing slowly, that’s pretty flat land. The opposite of flat is steep. Where is the steepest part of this map?
Steepest is where the lines are closest together. I marked that with a red circle. If the outer most line is 150 feet above sea level, and each line is 25 feet of elevation, what is elevation at point A?
COUNT: 150 feet to start PLUS25 ft + 25 ft + 25 ft + 25 ft + 25 ft + 25 ft = 300 feet of elevation in total. (1) (2) (3) (4) (5) (6) lines 5 + 6 are too small to number If the outer most line is 150 feet above sea level, and each line is 25 feet of elevation, what is elevation at point A? 1 4 3 2