Download
1 / 13
140 likes | 170 Views
Learn how to represent and analyze proportional relationships using graphs, plotting points accurately, labeling axes, identifying proportional relationships in real-world scenarios, and interpreting graphs to determine steepness and constant of proportionality. Practice graphing rules and explore activities to enhance your understanding.

E N D
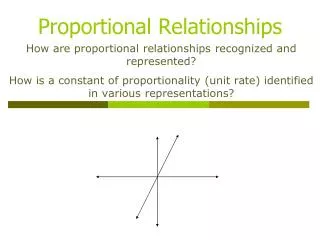
4.3 Proportional Relationships and Graphing How can you use graphs to represent and analyze proportional relationships?
Graphing Rules • Look at your data • Set up your graph • Use the ENTIRE graph • Plot your points as accurately as possible • Label your axis’ • Label your graph • Order Pairs (x,y) • Origin (0,0) • Practice Graphing
Explore activity • Complete page 129 Explore Activity with a partner
Identifying Proportional Relationships • Step 1- Create a table • Step 2 – Write the data in the table as ordered pairs (x,y) • Step 3 – Graph the ordered pairs • Plot each point • Draw one line from the origin, connecting points if possible
Example 1 • A house cleaning company charges $45 per hour. Is the relationship a proportional relationship? Explain. • Step 1. Make a table • Step 2. Write the data in the table as ordered pairs (time,cost) • (1,45) (2,90) (3,135) (5,225) (8,360) • Graph the ordered pairs • Step 3 - Look at the graph. Draw the line • The line goes through the origin therefore, it is a proportional relationship. The point (1,45) shows the unit rate is $45 for 1 hour
Your Turn • Page 130 #1
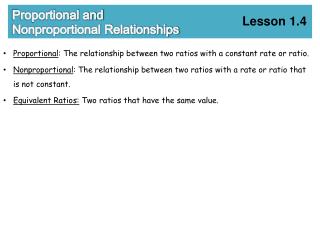
Analyzing Graphs • Proportional relationship is represented with the formula y=kx • In the graph k tells you how steep the graph of the relationship will be. • The larger number k is the steeper your graph will be.
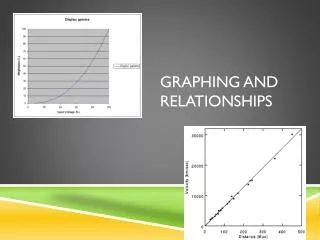
Example 2 • Show graph – The graph shows the relationship between time in minutes and the number of miles Damon runs. Write and equation for this relationship • Step 1 – choose a point on the graph and tell what the point represents • (10,1) (20,2) (30,3) • Step 2- what is the constant of proportionality? • Yes, k= • Step 3 – write an equation in the form of y=kx • y= x
Example 2 reflect • What does the point (0,0) on the graph represent? • The distance (0 miles) that Damon runs in 0 minutes • Suppose you drew a graph representing the relationship y=between time in minutes and the number of miles Esther runs. How would the graph compare to the one for Damon? Explain • Esther’s graph would be steeper; mi/min > mi/min
Your turn • Page 131 #4 a-c
Guided practice • Page 132 # 1-7 • IDK or I don’t know are NOT appropriate answers
Independent Practice • Page 133-134 #1-18
Assessment • 4.3 Assessment • Pg 135 # 1-9 Ready to go on?