Download
1 / 6
70 likes | 150 Views
Graphing Relationships are descriptions of how two variables relate on a graph. Learn about Direct, Indirect, Cyclic, and Dynamic Equilibrium relationships, with clear examples for deeper understanding.

E N D
Graphing Relationships are… 1. …descriptions of how two variables relate to each other on a graph. 2. …usually structured “As _________ increases, __________ (increases/decreases.)” 3. …fall into 4 categories: a) Direct Relationship b) Indirect Relationship c) Cyclic Relationship d) Dynamic Equilibrium
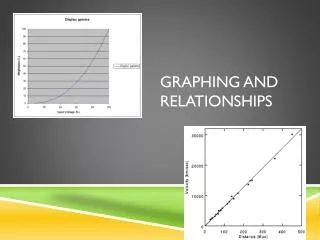
Direct Relationship A direct relationship is when one variable increases, so does the other. They look like this:
Indirect (or Inverse) Relationship An indirect relationship is when one variable increases, the other decreases. They look like this:
Cyclic Relationship A cyclic relationship repeats itself over time. They look like this:
Dynamic Equilibrium When the line on the graph always eventually comes back to the same place. They look like this: