Download

1 / 68
950 likes | 1.9k Views
NUTRITION SCREENING & ASSESSMENT. Dr Yahya Pasdar Kermanshah University of Medical Sciences Yahya.pasdar@kums.ac.ir www.Drpasdar.com. Nutritional Screening & Assessment Overall View. Screening Assessment Available Tools Validity and Reliability Take Home Massage.

E N D
NUTRITION SCREENING & ASSESSMENT Dr Yahya Pasdar Kermanshah University of Medical Sciences Yahya.pasdar@kums.ac.ir www.Drpasdar.com
Nutritional Screening & Assessment Overall View • Screening • Assessment • Available Tools • Validity and Reliability • Take Home Massage
Nutrition Care Process Model Ø Screening & Referral System Ø Identify risk factors Ø Use appropriate tools and methods Ø Involve interdisciplinary collaboration Nutrition Diagnosis Ø Identify and label problem Nutrition Assessment Ø Determine cause/contributing risk Ø Obtain/collect timely and factors appropriate data Ø Cluster signs and symptoms/ Ø Analyze/interpret with defining characteristics evidence - based standards Ø Document Document Relationship Between Patient/Client/Group Nutrition Intervention Dietetics & Ø Plan nutrition intervention · Professional Formulate goals and determine a plan of action Implement the nutrition intervention Ø · Care is delivered and actions Nutrition Monitoring and - are carried out Evaluation Ø Documen t Ø Monitor progress Ø Measure outcome indicators Ø Evaluate outcomes Ø Document Outcomes Management Sys tem Ø Monitor the success of the Nutrition Care Process implementation Ø Evaluate the impact with aggregate data Ø Identify and analyze causes of less than optimal performance and outcomes Ø Refine the use of the Nutrition Care Process
Effects of under-nutrition on organ function Psychology – depression & apathy Ventilation - loss of muscle & hypoxic responses Immunity – Increased risk of infection liver fatty change, functional declinenecrosis, fibrosis Decreased cardiac output Renal function - loss of ability to excrete Na & H2O Impaired wound healing Hypothermia Impaired gut integrity and immunity Loss of strength Anorexia
Malnutrition & cancer Immune functions Survival Performance status Malnutrition (60~85%) Response to chemotherapy Muscle function Quality of life Van Cutsem et al., 2005 Mariette et al., 2012
The Malnutrition Carousel 28-34% of patients admitted to hospital are at risk of malnutrition Hospital Home More GP visits Longer stay More support post-discharge More likely to be discharged to Care Homes More hospital admissions Up to 70% of patients discharged from hospital weigh less than on admission
Why do we need to identify malnutrition? • Malnutrition is associated with: • length of stay in hospital • complications • hospital costs • mortality rates
Screening “Rapid, simple, general procedure done at first contact with subject to detect risk of malnutrition, done by nurses, doctors or other care workers” (Elia/ MAG 2003) Assessment “Detailed, more specific in depth evaluation of subject’s nutritional status, done by those with nutritional expertise” (Elia/ MAG 2003) Screening vs Assessment
Cancer patients are not all created equal…should we expect the impact of nutrition therapy to be the same across all patients?
Why screen for malnutrition? Malnutrition is not always visible, is more common than you think and costs health and social care ≥£13b/year At any one time, more than 3 million adults in UK are at risk 93% live in the community & 2% are in hospital where ~1 in 3 are at risk on admission Older people and those with chronic conditions are particularly at risk Help people stay independent and well in their own home as long as possible & reduce the need for admission into hospital
Why screen for malnutrition? Effective management of malnutrition reduces the burden on health & care resources Regular screening is the only way that malnourished individuals can be identified and appropriate action taken Recommended / required by variousbodies e.gNICE, NHSQIS, Council of Europe, Care Quality Commission, Nutrition Action Plan
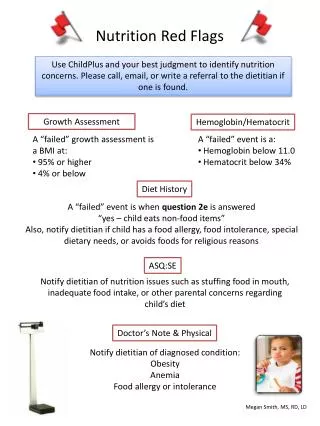
What is clinical concern? Unintentional weight loss, fragile skin, poor wound healing, apathy, wasted muscles, poor appetite, impaired swallowing, altered bowel habit, loose fitting clothes or prolonged inter-current illness.(NICE 2006)
Characteristics of Nutrition Screening Simple and easy to complete Routine data Cost effective Effective in identifying nutritional problems Reliable and valid
Screening: Nutrition Care Indicators • Nutritional history • Appetite • Nausea/vomiting (>3 days) • Diarrhea • Dysphagia • Reduced food intake (<50% of normal for 5 days) • Feeding modality • TPN/PPN • TF • Diet restrictions • Unintentional Weight Loss • >10 lbs in past 3 months • Serum Albumin • Diagnosis • Cachexia, end-stage liver or kidney disease, coma, malnutrition, decubitis ulcers, cancer of GI tract, Crohns, Cystic Fibrosis, new onset diabetes, eating disorder • Above used to determine nutritional risk and need for referral to RD
Nutrition Screening Tools • Requirements • quick and simple to administer • sensitive enough to identify individuals at risk • appropriate for client group being screened • capable of being used by non-dietitians • reproducible when used by different observers • able to guide non dietetic staff into taking appropriate action for findings recorded
Nutritional Screening Tools • No single / standard way of assessing nutritional status • Various validated assessment tools developed • some disease specific • some age specific • 2 examples • Mini Nutritional Assessment (MNA) • Subjective Global Assessment (SGA)
‘Malnutrition Universal Screening Tool’ (‘MUST’) A simple 5 step validated tool for use by all care workers in all care settings: Step 1-height and weight to obtain BMI Step 2- recent unintentional weight loss Step 3- effect of acute disease Step 4- overall score / category of risk Step 5- management guidelines
Malnutrition Screening Tool (MST) If the score is 2 or more please refer to the dietitian. (Ref: Ferguson M et al, Nutrition 15: 458-464, 1999)
‘MUST’ e-learning Link to Hospital module: https://secure.digitalroutes.co.uk/bapen
Mini Nutritional Assessment (MNA) • Screening and Assessment tool for the identification of malnutrition in the elderly • Considers: • Dietary Intake – foods, patterns • Weight change, BMI, Muscle circumferences • Functional impairment, Independence, Living arrangements • Psychological issues, Self assessment
Subjective Global Assessment • Valid assessment tool • Strong correlation with other subjective and objective measures of nutrition • Highly predictive of nutritional status in a number of different patient groups • Quick, simple and reliable
Subjective Global Assessment…features • Medical History • Weight change • Dietary intake • GI symptoms • Functional impairment • Physical Examination • Loss of subcutaneous fat • Muscle wasting • Oedema and ascites
Subjective Global Assessment…Classifications A Well nourished B Moderately malnourished or suspected of malnutrition C Severely malnourished
Full Nutrition AssessmentStep 1…Data collection • Systematic Approach • Assessment based on clinical/psychosocial/physical information • Dietary • Anthropometric • Biochemical • Physical • Including • Subjective (eg. signs/symptoms of nutritional problem, appetite) • Objective (eg. Lab results)
Data Collection…An Example… A B C D E A Anthropometry B Biochemical Data C Clinical signs and symptoms, medical condition D Dietary Intake E Exercise (Energy balance – expenditure) Consider current level, history and changes
Height Weight Weight history / pattern (% weight change) Weight for Height BMI Growth Pattern, head circumference (paediatrics) MAMC TSF Waist circumference Hip circumference WHR Be aware of fluid status, presence of oedema. Anthropometry
Anthropometrics • Ideal body weight • Males: 106 lbs + 6 lbs per inch over 5 ft • Females: 100 lbs + 5 lbs per inch over 5 ft • Add 10% for large-framed and subtract 10% for small-framed • %IBW = (current wt/IBW) X 100 • 80-90% mild malnutrition • 70-79% moderate malnutrition • 60-69% severe malnutrition • <60% non-survival
Anthropometrics • %UBW: usual body weight • = (current wt/UBW) X 100 • 85-95% mild malnutrition • 75-84% moderate malnutrition • 0-74% severe malnutrition • % weight change = usual weight – present weight/usual weight X 100 • Significant weight loss • >5% in 1 month • >10% in 6 months
Body Mass Index = BMI • Evaluation of body weight independent of height • BMI = weight (kg)/height2 (m) • >40 obesity III • 30-40 obesity II • 25-30 overweight • 18.5-25 normal • 17-18.4 PEM I • 16-16.9 PEM II • <16 PEM III
Bioelectrical Impedance Analysis (BIA) • Measures electrical conductivity through water in difference body compartments • Uses regression equations to determine fat and LBM • Serial measures can track changes in body composition • Obesity treatments
DEXA: dual-energy X-ray absorptiometry • Whole body scan with 2 x-rays of different intensity • Computer programs estimate • Bone mineral density • Lean body mass • Fat mass • “Best estimate” for body composition of clinically available methods
Anthropometrics: additional methods • Research methods: precise, but cost prohibitive • Total body potassium • Underwater weight (hydrodensitometry) • Deuterated water dilution • Muscle strength and endurance
Biochemistry & other Blood Tests(See also disease/condition specific lectures) • Objective measures • No single test is diagnostic • Consider “normal / recommended range” for various and combination of conditions, eg. age, gender, physiological state, disease type and stage • Consider clinical significance of test result • Test result may reflect immediate intake (eg glucose) or long term status (HbA1c)
Other factors to Consider… • Other factors can mask/influence test results eg. • Acute phase response due to stress / injury ( reduced albumin) • GI bleed (higher urea) • Blood transfusion (higher serum K and Hb) • Surgery (lower Hb and albumin)
Nutritional Indicators • Ideal indicator or marker is sensitive and specific to nutritional intake Commonly Used “Nutritional Indicators” • Albumin • Pre-albumin • Transferrin • Retinol-binding protein
Albumin • Synthesised in the liver • May be useful indicator of nutritional status in “healthy” person. • Not a good indicator of protein status during critical illness (due to acute phase response) • Long half life (14-20 days) and large body pool slow to respond to improvements in clinical status
Factors Affecting Serum Albumin Levels Increased in: • Dehydration, blood transfusions, exogenous albumin Decreased in: • Overhydration, hepatic failure, inflammation, infection, metabolic stress, post-op, bed rest, pregnancy, nephrotic syndrome.
Pre-albumin • Also known as Transthyretin, thyroxine binding protein. • Synthesised in the liver • Relatively short half life (2 days) • Negative acute phase reactant - with inflammatory response • May be useful in healthy population
Transferrin and RBP Transferrin • Half life 8-10 days • Poor correlation with nutrition status • Involved with iron transport, influenced by iron status Retinol Binding Protein (RBP) • Half life 12 hours • Affected by renal function, Vitamin A and Zn status • Unreliable measure of nutritional status
C-reactive protein • Positive acute phase respondent • Increases early in acute stress as much as 1000-fold • Decreased correlates with end of acute phase and beginning of anabolic phase where nutritional repletion is possible
Creatinine Height Index • Estimates LBM • = actual creat excretion (24 hour urine collection) expected creat excretion • Males: IBW X 23 mg/kg • Females: IBW X 18 mg/kg • >80% normal • 60-80% moderately depleted • <60% severely depleted • Accurate 24-hr urine collection is difficult to obtain in acute-care setting
Biochemistry & other Blood Tests, cont’d • Interference – drugs, sampling • Nutrient-nutrient interactions, drug-nutrient interactions • Be aware of hydration status • Must interpret lab results with other nutritional parameters
Clinical issues to consider: • Medical history, treatment and medications • Significant factors affecting nutritional intake • Fluid balance – input and output, Bowel habits • Physical assessment of nutritional status • Clinical signs and symptoms
Signs Subjective, impression Descriptive, observation Appearance Visual examination Needs clinical judgement Eg muscle wasting, malnutrition Symptoms Recall, report by subjects Descriptive Eg nausea, itchiness, diarrhoea, anorexia Clinical Signs and Symptoms
Dietary Intake • Is intake meeting requirement? • Basic nutrition adequacy • Special requirement / disease / conditions • Consider factors affecting intake • Consider clinical, nutritional and psycho-social issues • Methods of collecting information/data • ? Relevant and practical