Download
1 / 21
220 likes | 237 Views
Learn how GIS technology is utilized to predict pollution contents in surface water runoff. Explore data sources and models used, such as BASINS and HSPF, to assess pollutants and impacts on watersheds and land use. Discover how GIS helps locate impaired reaches and assess contaminants, enabling better pollution management strategies.

E N D
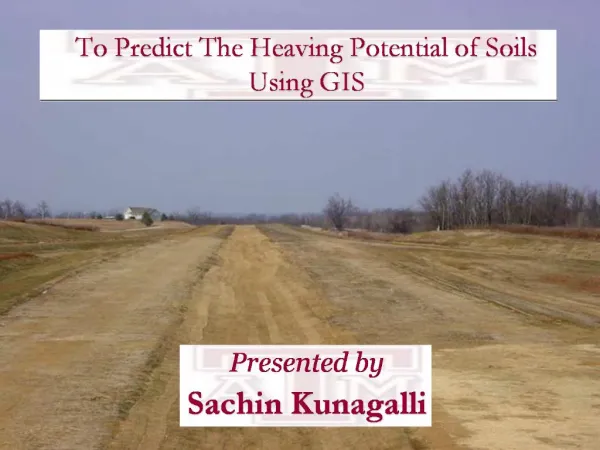
Use of GIS to Predict Pollution Contents in Surface Water Runoff By Muhammad Kashif Gill kashif@cc.usu.edu435-797-6456
Introduction • Pollution problems in surface water • What EPA says • How GIS helps
Objectives • To locate impaired reaches • To evaluate the extent of contaminants
Data Sources • BASINS (Better Assessment Science Integrating Point and Nonpoint Sources) • BASINS Utilities • USGS and EPA Data Sources
BASINS Models • HSPF (Hydrologic simulation program, FORTRAN) • Qual2e • PLOAD • Swat
PLOAD • Estimation of nonpoint sources pollution • Allowance to use BMP’s in calculation • Wider Applicability
PLOAD Inputs • Landuse data • Watershed data • BMP (Optional) • Pollutant loading rate • Pollutant reduction BMP’s tables (Optional)
Export Coefficient Method LP= ∑U ( LPU * AU ) where LP = Pollutant load ,lbs LPU = Pollutant loading rate for landuse type u, lbs/acre/yr AU = Area of land use type u, acres
OUTPUT • Total pollutant loads in watershed • Per acre pollutant load in watershed
Pollutants • BOD • COD • NOX • NH3 • TP • DP • TSS • TDS • TKN
http://www.eq.state.ut.us/EQWQ/watersheds/bear/Bear_river_2001_assess.pdfhttp://www.eq.state.ut.us/EQWQ/watersheds/bear/Bear_river_2001_assess.pdf
Pollutant Layouts TP NOX NH3 DP
Pollutant Layouts BOD COD TSS TDS
Conclusions/Future Work • Major area in the watershed is severely affected by Phosphorous and Nitrogen • BASINS package can be utilized further to account for BMPs