Download
1 / 44
440 likes | 458 Views
Analyzing incident and prevalent ESRD patient counts by modality, payor, and network, examining geographic variations in rates for hemodialysis, peritoneal dialysis, and transplant between 1999-2000.

E N D
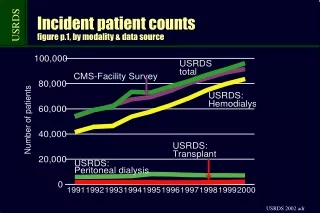
Incident patients, by modality & data sourcefigure 3.1, incident ESRD patients, 2000
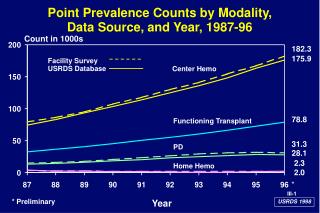
Prevalent patients, by modality & data sourcefigure 3.2, December 31 point prevalent patients, by data source
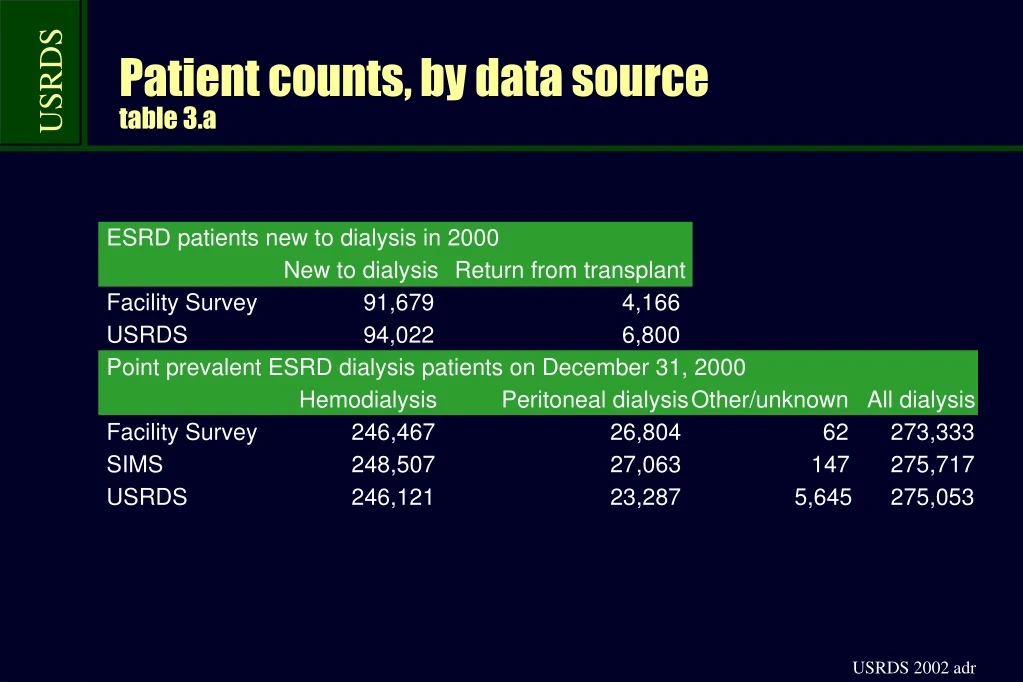
Incident counts, by data sourcetable 3.b, incident ESRD patients
Percent distribution of incident patients, by first modality (row percent)table 3.c, incident ESRD patients, 1998-2000 combined
Percent distribution of incident patients, by first modality (row percent)table 3.c, incident ESRD patients, 1998-2000 combined (cont.)
Incident patient distribution, by modality & ESRD networktable 3.d, incident ESRD patients, 1998-2000 combined
Incident patients by initial modality, by ESRD networkfigure 3.4, incident ESRD patients, 2000
Incident patients, by modality & payorfigure 3.5, incident ESRD patients, 2000
Incident patients, by modality & payorfigure 3.5, incident ESRD patients, 2000 (cont.)
Incident patients, by modality, payor, & ESRD networkfigure 3.6, incident ESRD patients, 2000
Incident patients, by modality, payor, & ESRD networkfigure 3.6, incident ESRD patients, 2000 (cont.)
Geographic variations in incident rates:hemodialysisfigure 3.7, incident ESRD patients, 1999-2000 combined, by HSA, unadjusted Rate per million population 348+ (432) 280 to <348 237 to <280 194 to <237 below 194 (163)
Geographic variations in incident rates:peritoneal dialysisfigure 3.7, incident ESRD patients, 1999-2000 combined, by HSA, unadjusted Rate per million population 36.7+ (53.3) 29.1 to <36.7 22.9 to <29.1 17.3 to <22.9 below 17.3 (13.8)
Geographic variations in incident rates:transplantfigure 3.7, incident ESRD patients, 1999-2000 combined, by HSA, unadjusted Rate per million population 7.59+ (9.89) 6.13 to <7.59 5.33 to <6.13 4.67 to <5.33 below 4.67 (4.10)
Trends in prevalent countsfigure 3.8, December 31 point prevalent ESRD patients
Trends in prevalent countsfigure 3.8, December 31 point prevalent ESRD patients (cont.)
Prevalent counts, by data sourcetable 3.e, December 31 point prevalent dialysis patients
Percent distribution of prevalent patients, by modality (row percent)table 3.f, December 31 point prevalent ESRD patients, 2000
Percent distribution of prevalent patients, by modality (row percent)table 3.f, December 31 point prevalent ESRD patients, 2000 (cont.)
Prevalent patient distribution, by modality & ESRD networktable 3.g, December 31 point prevalent ESRD patients, 1998-2000 combined
Prevalent patients by initial modality, by ESRD networkfigure 3.9, December 31 point prevalent ESRD patients, 2000
Prevalent patients, by modality & payorfigure 3.10, December 31 point prevalent ESRD patients
Prevalent patients, by modality & payorfigure 3.10, December 31 point prevalent ESRD patients (cont.)
Prevalent patients, by modality, payor, & networkfigure 3.11, December 31 point prevalent ESRD patients, 2000
Prevalent patients, by modality, payor, & networkfigure 3.11, December 31 point prevalent ESRD patients, 2000 (cont.)
Geographic variations in prevalent rates:hemodialysisfigure 3.12, December 31 point prevalent ESRD patients, 2000, by HSA, unadjusted Rate per million population 1,030+ (1,400) 790 to <1,030 640 to <790 520 to <640 below 520 (430)
Geographic variations in prevalent rates:peritoneal dialysisfigure 3.12, December 31 point prevalent ESRD patients, 2000, by HSA, unadjusted Rate per million population 119.7+ (161.2) 91.4 to <119.7 73.8 to <91.4 56.5 to <73.8 below 56.5 (44.9)
Geographic variations in prevalent rates:transplantfigure 3.12, December 31 point prevalent ESRD patients, 2000, by HSA, unadjusted Rate per million population 400+ (467) 364 to <400 335 to <364 308 to <335 below 308 (287)
Incident patient distribution, by modality & profit statusfigure 3.13, incident ESRD patients
Incident patient distribution, by modality & unit affiliationfigure 3.14, incident ESRD patients
Geographic variations in incident rates:hemodialysis, for-profitfigure 3.15, incident ESRD patients, 1999-2000 combined, by HSA, unadjusted Rate per million population 207.7+ (270.8) 143.5 to <207.7 88.0 to <143.5 39.6 to <88.0 below 39.6 (20.7)
Geographic variations in incident rates:peritoneal dialysis, for-profitfigure 3.15, incident ESRD patients, 1999-2000 combined, by HSA, unadjusted Rate per million population 26.3+ (42.1) 18.3 to <26.3 11.6 to <18.3 6.1 to <11.6 below 6.1 (3.5)
Geographic variations in incident rates:hemodialysis, non-profitfigure 3.15, incident ESRD patients, 1999-2000 combined, by HSA, unadjusted Rate per million population 133.2+ (193.9) 73.9 to <133.2 34.4 to <73.9 16.5 to <34.4 below 16.5 (10.5)
Geographic variations in incident rates:peritoneal dialysis, for-profitfigure 3.15, incident ESRD patients, 1999-2000 combined, by HSA, unadjusted Rate per million population 11.48+ (22.10) 6.17 to <11.48) 3.75 to <6.17 2.28 to <3.75 below 2.28 (1.47)
Prevalent patient distribution, by modality & profit statusfigure 3.16, December 31 point prevalent patients
Prevalent patient distribution, by modality & unit affiliationfigure 3.17, December 31 point prevalent patients
Geographic variations in prevalent rates:hemodialysis, for-profitfigure 3.18, December 31 point prevalent patients, 2000, by HSA, unadjusted Rate per million population 848+ (1,233) 595 to <848 386 to <595 162 to <386 below 162 (69)
Geographic variations in prevalent rates:peritoneal dialysis, for-profitfigure 3.18, December 31 point prevalent patients, 2000, by HSA, unadjusted Rate per million population 92.8+ (142.0) 61.3 to <92.8 39.7 to <61.3 18.7 to <39.7 below 18.7 (10.5)
Geographic variations in prevalent rates:hemodialysis, non-profitfigure 3.18, December 31 point prevalent patients, 2000, by HSA, unadjusted Rate per million population 306.9+ (51.9) 89.7 to <306.9 36.1 to <89.7 16.0 to <36.1 below 16.0 (9.4)
Geographic variations in prevalent rates:peritoneal dialysis, for-profitfigure 3.18, December 31 point prevalent patients, 2000, by HSA, unadjusted Rate per million population 28.5+ (58.4) 12.5 to <28.5 6.7 to <12.5 4.1 to <6.7 below 4.1 (2.7)
Patients transplanted, by unit affiliationfigure 3.19, period prevalent dialysis patients, 2000