Download
1 / 39
390 likes | 731 Views
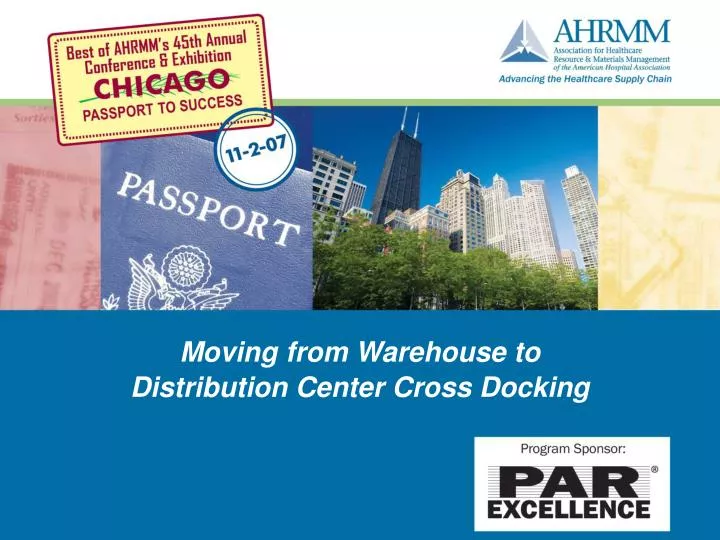
Moving from Warehouse to Distribution Center Cross Docking. Todd Brandt Unit Head - Logistics Warehousing Tom Stewart Finance Manager Materials Management Financial Analysis Mayo Clinic Rochester, MN. Agenda. Mayo Clinic Background Warehouse vs. Distribution Center Need for Change

E N D
Todd Brandt Unit Head - Logistics Warehousing Tom Stewart Finance Manager Materials Management Financial Analysis Mayo Clinic Rochester, MN
Agenda • Mayo Clinic Background • Warehouse vs. Distribution Center • Need for Change • Road to Success • Value
Mayo’s Mission • Mayo will provide the best care to every patient every day through integrated clinical practice, education, and research. • Primary Value • The needs of a patient come first.
Mayo Clinic Mayo Clinic Scottsdale, AZ Mayo Clinic Rochester, MN Mayo Clinic Jacksonville, FL St. Luke’s Hospital Rochester Methodist Hospital Mayo Clinic Hospital Charter House Saint Marys Hospital Mayo Health System* * A network of clinics and hospitals in 64 communities in southern Minnesota, northern Iowa, and western Wisconsin
Mayo Clinic Rochester 28,080 Employees* 322,772 Unique Patients* 1,951 Licensed Beds* 77 Buildings $633M of Supply Spend *as of 9/06
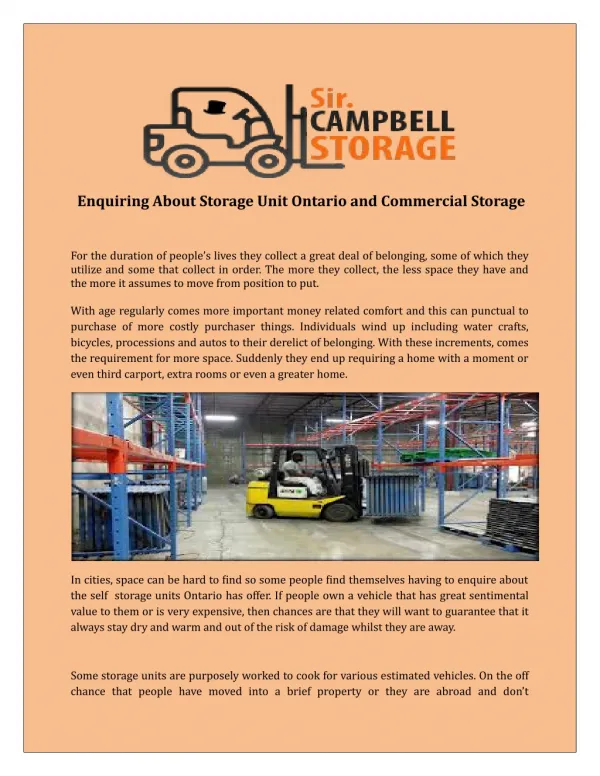
Mayo Distribution Center • 60,000 sq ft with 24 ft Ceilings • 5,000 sq ft Mezzanine • 4,000 sq ft Controlled Environment Area • 8,000 Lines / day Ordered • > 50% low unit measure lines • 700 Customer Requisitions Daily • 400 – 500 Receiving Lines Daily • Average Tenure = 16 Years
What is a Warehouse? • Warehouse • Storage • Minimize expense • Fill it up! • Few metrics
Past- The 90’s • Product Migration • Inventory • Low visibility • Few policies and procedures • No stocking criteria • Traditional Approach • Fill it up!
Past- New Millennium • Product Stabilization • Inventory • Increased visibility • Develop policies and procedures • Unofficial stocking criteria • Guarded Approach • Limited space available
Need for Change • Customer Needs • Just in time • Low unit of measure • Growth • Space utilization • Financial Viability • Change patient demographics • Improving cost structure
What is a Distribution Center? • Distribution Center • Organized process • Customer focused • Unique demands • Visible metrics • Cross docking • Consolidation area
Road to success • Assemble Team • Create Strategy Map • Determine Baseline • Implement Plan • Measure Progress • Have Some FUN!
Assembled Team • Leadership Sponsor • Analytical Staff • Line Staff • Supervisors • Systems Support • Consultant
Strategy Map • Current State • Future State • Road Map
Slow Moving Parts • Defined Slow Moving • Identify Items • Criteria • Communicate • Disposition • Monitor
Velocity and ABC Codes • What is Needed • Create Legend • Slotting • Correct Size • Label SKUs • Reporting
“A” Velocity SKUs Current Locations 631 “A” SKUs 29 Pick Aisles 2 Floors 427 Over-Stock Locations
Order Management and Staff Optimization • Current Patterns • Institution Needs • Customer Needs • Who Controls? • Change
Technology • Enterprise Resource Planning • Point of Use • Warehouse Management • Lot tracking • Expiration tracking • Electronic transactions • Staff productivity
Standard Operating Procedures (SOP’s) • Requires Process Changes • Inventory control • Slotting • Receiving • Picking • Cycle counting • Communication Tool • Change Behaviors
Distribution Processing* • Customers Needs • Lean Process • Save Space • Reduced Inventor * Internal or External
Cross Docking • Consolidation • Non-stocks • Delivery Times • Reduce trips • Space
Current State • Stock to Non-stock • Inventory • High visibility • Turns • Implement SOP’s • Official stocking criteria • Lean Approach • Low unit of measure
“A” Velocity SKUs New Locations 631 “A” SKUs 10 Pick Aisles Ground Floor 211 Over-Stock Locations
Value • Customer Satisfaction • Right product • Right place • Right time • Growth • Optimize space needed for growth • Financial Viability • Optimize Staffing • Improved inventory turnover • Inventory reductions
9.5% C O S 8.0% T 6.5% T O 5.0% S E R 3.5% V E 2.0% SCHEDULED NEXT DAY LOW UNIT DEL LOW UNIT TO UNLIMITED 98%+ FILL CROSS + + BULK DEL. 3 + BULK DEL.. 5 + TO PAR LOC 5 + PAR LOC. 7 + STAT ORDER RATE DOCKING DAYS/ WK DAYS/ WK DAYS/WK DAYS/WK DEL COMMITMENT SERVICES SERVICE OFFERING Cost to Serve Benchmarks *Data provided by National Medical Logistics
Future State • Laboratory Expansion • Lot track • Temperature sensitive • Clinical Growth • Space constraints • Flexibility
Best Practices • Key Performance Indicators • Documented SOPs • Point-of-use Replenishment Process • Scheduled Pick Waves • Scheduled Deliveries • Velocity Slotting
Summary • Evolution • Traditional warehouse • Distribution model • Customer • Flexibility • Value • Lower cost • Quality
Q & A brandt.todd@mayo.edu stewart.thomas@mayo.edu