Download
1 / 72
720 likes | 735 Views
An overview of recent findings from LHC data analysis, including issues in predicting UE and MB data, strange particle production, new physics in min-bias collisions, and insights into high transverse momentum jet interactions. The talk explores the underlying event, the transverse region, and charged particle correlations.

E N D
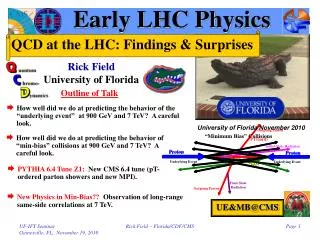
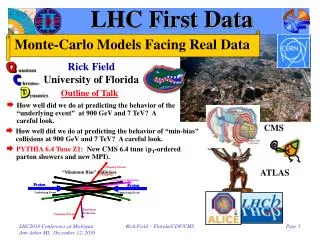
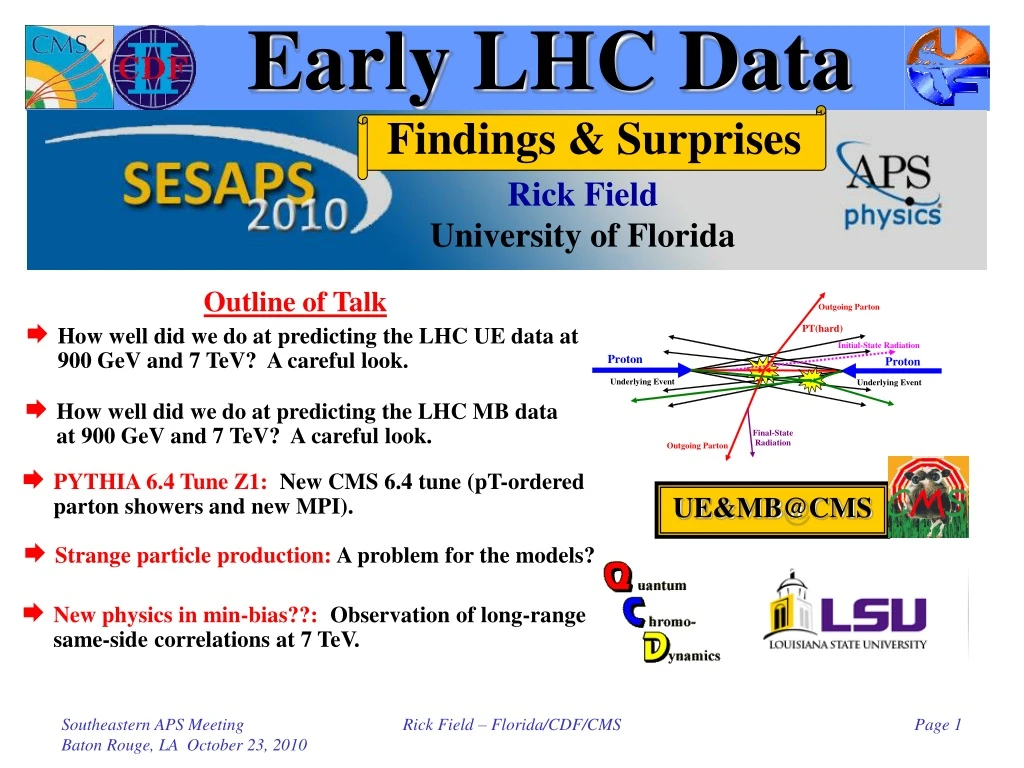
Early LHC Data Findings & Surprises Rick Field University of Florida Outline of Talk • How well did we do at predicting the LHC UE data at 900 GeV and 7 TeV? A careful look. • How well did we do at predicting the LHC MB data at 900 GeV and 7 TeV? A careful look. • PYTHIA 6.4 Tune Z1: New CMS 6.4 tune (pT-ordered parton showers and new MPI). UE&MB@CMS • Strange particle production: A problem for the models? • New physics in min-bias??: Observation of long-range same-side correlations at 7 TeV. Rick Field – Florida/CDF/CMS
“Hard Scattering” Component QCD Monte-Carlo Models:High Transverse Momentum Jets • Start with the perturbative 2-to-2 (or sometimes 2-to-3) parton-parton scattering and add initial and final-state gluon radiation (in the leading log approximation or modified leading log approximation). “Underlying Event” • The “underlying event” consists of the “beam-beam remnants” and from particles arising from soft or semi-soft multiple parton interactions (MPI). • Of course the outgoing colored partons fragment into hadron “jet” and inevitably “underlying event” observables receive contributions from initial and final-state radiation. Rick Field – Florida/CDF/CMS
“Hard Scattering” Component QCD Monte-Carlo Models:High Transverse Momentum Jets • Start with the perturbative 2-to-2 (or sometimes 2-to-3) parton-parton scattering and add initial and final-state gluon radiation (in the leading log approximation or modified leading log approximation). “Underlying Event” • The “underlying event” consists of the “beam-beam remnants” and from particles arising from soft or semi-soft multiple parton interactions (MPI). The “underlying event” is an unavoidable background to most collider observables and having good understand of it leads to more precise collider measurements! • Of course the outgoing colored partons fragment into hadron “jet” and inevitably “underlying event” observables receive contributions from initial and final-state radiation. Rick Field – Florida/CDF/CMS
The “Transverse” Region • Look at charged particle correlations in the azimuthal angle Df relative to the leading charged particle jet. • Define |Df| < 60o as “Toward”, 60o < |Df| < 120o as “Transverse”, and |Df| > 120o as “Away”. • All three regions have the same area in h-f space, Dh ×Df = 2hcut× 120o = 2hcut× 2p/3. • Construct densities by dividing by the area in h-f space. Charged Particle Df Correlations PT > 0.5 GeV/c |h| < hcut Look at the charged particle density in the “transverse” region! “Transverse” region very sensitive to the “underlying event”! CDF Run 1 Analysis hcut = 1 Rick Field – Florida/CDF/CMS
The “Transverse” Region Traditional Approach! • Look at charged particle correlations in the azimuthal angle Df relative to the leading charged particle jet. • Define |Df| < 60o as “Toward”, 60o < |Df| < 120o as “Transverse”, and |Df| > 120o as “Away”. • All three regions have the same area in h-f space, Dh ×Df = 2hcut× 120o = 2hcut× 2p/3. • Construct densities by dividing by the area in h-f space. Charged Particle Df Correlations PT > 0.5 GeV/c |h| < hcut Look at the charged particle density in the “transverse” region! “Transverse” region very sensitive to the “underlying event”! CDF Run 1 Analysis hcut = 1 Rick Field – Florida/CDF/CMS
“Transverse” Charged Particle Density • Fake data (from MC) at 900 GeV on the “transverse” charged particle density, dN/dhdf, as defined by the leading charged particle (PTmax) and the leading charged particle jet (chgjet#1) for charged particles with pT > 0.5 GeV/c and |h| < 2. The fake data (from PYTHIA Tune DW) are generated at the particle level (i.e. generator level) assuming 0.5 M min-bias events at 900 GeV (361,595 events in the plot). Leading Charged Particle Jet, chgjet#1. Leading Charged Particle, PTmax. Rick Field MB&UE@CMS Workshop CERN, November 6, 2009 Rick Field – Florida/CDF/CMS
“Transverse” Charged Particle Density • Fake data (from MC) at 900 GeV on the “transverse” charged particle density, dN/dhdf, as defined by the leading charged particle (PTmax) and the leading charged particle jet (chgjet#1) for charged particles with pT > 0.5 GeV/c and |h| < 2. The fake data (from PYTHIA Tune DW) are generated at the particle level (i.e. generator level) assuming 0.5 M min-bias events at 900 GeV (361,595 events in the plot). • CMS preliminary data at 900 GeV on the “transverse” charged particle density, dN/dhdf, as defined by the leading charged particle (PTmax) and the leading charged particle jet (chgjet#1) for charged particles with pT > 0.5 GeV/c and |h| < 2. The data are uncorrected and compared with PYTHIA Tune DW after detector simulation (216,215 events in the plot). Rick Field – Florida/CDF/CMS
“Transverse” Charged PTsum Density • Fake data (from MC) at 900 GeV on the “transverse” charged PTsum density, dPT/dhdf, as defined by the leading charged particle (PTmax) and the leading charged particle jet (chgjet#1) for charged particles with pT > 0.5 GeV/c and |h| < 2. The fake data (from PYTHIA Tune DW) are generated at the particle level (i.e. generator level) assuming 0.5 M min-bias events at 900 GeV (361,595 events in the plot). • CMS preliminary data at 900 GeV on the “transverse” charged PTsum density, dPT/dhdf, as defined by the leading charged particle (PTmax) and the leading charged particle jet (chgjet#1) for charged particles with pT > 0.5 GeV/c and |h| < 2. The data are uncorrected and compared with PYTHIA Tune DW after detector simulation (216,215 events in the plot). Rick Field – Florida/CDF/CMS
PYTHIA Tune DW Leading Charged Particle Jet, chgjet#1. • CMS preliminary data at 900 GeV and 7 TeV on the “transverse” charged particle density, dN/dhdf, as defined by the leading charged particle jet (chgjet#1) for charged particles with pT > 0.5 GeV/c and |h| < 2. The data are uncorrected and compared with PYTHIA Tune DW after detector simulation. Rick Field – Florida/CDF/CMS
PYTHIA Tune DW Leading Charged Particle, PTmax. • ATLAS preliminary data at 900 GeV and 7 TeV on the “transverse” charged particle density, dN/dhdf, as defined by the leading charged particle (PTmax) for charged particles with pT > 0.5 GeV/c and |h| < 2.5. The data are corrected and compared with PYTHIA Tune DW at the generator level. Rick Field – Florida/CDF/CMS
PYTHIA Tune DW CMS ATLAS • ATLAS preliminary data at 900 GeV and 7 TeV on the “transverse” charged particle density, dN/dhdf, as defined by the leading charged particle (PTmax) for charged particles with pT > 0.5 GeV/c and |h| < 2.5. The data are corrected and compared with PYTHIA Tune DW at the generator level. • CMS preliminary data at 900 GeV and 7 TeV on the “transverse” charged particle density, dN/dhdf, as defined by the leading charged particle jet (chgjet#1) for charged particles with pT > 0.5 GeV/c and |h| < 2. The data are uncorrected and compared with PYTHIA Tune DW after detector simulation. Rick Field – Florida/CDF/CMS
PYTHIA Tune DW CMS ATLAS • ATLAS preliminary data at 900 GeV and 7 TeV on the “transverse” charged PTsum density, dPT/dhdf, as defined by the leading charged particle (PTmax) for charged particles with pT > 0.5 GeV/c and |h| < 2.5. The data are corrected and compared with PYTHIA Tune DW at the generator level. • CMS preliminary data at 900 GeV and 7 TeV on the “transverse” charged PTsum density, dPT/dhdf, as defined by the leading charged particle jet (chgjet#1) for charged particles with pT > 0.5 GeV/c and |h| < 2. The data are uncorrected and compared with PYTHIA Tune DW after detector simulation. Rick Field – Florida/CDF/CMS
“Transverse” Charge Density Rick Field MB&UE@CMS Workshop CERN, November 6, 2009 factor of 2! 900 GeV → 7 TeV (UE increase ~ factor of 2) LHC 900 GeV LHC 7 TeV ~0.4 → ~0.8 • Shows the charged particle density in the “transverse” region for charged particles (pT > 0.5 GeV/c, |h| < 2) at 900 GeV and 7 TeVas defined by PTmax from PYTHIATune DW andat the particle level (i.e. generator level). Rick Field – Florida/CDF/CMS
PYTHIA Tune DW CMS ATLAS • Ratio of CMS preliminary data at 900 GeV and 7 TeV on the “transverse” charged particle density, dN/dhdf, as defined by the leading charged particle jet (chgjet#1) for charged particles with pT > 0.5 GeV/c and |h| < 2. The data are uncorrected and compared with PYTHIA Tune DW after detector simulation. • Ratio of the ATLAS preliminary data at 900 GeV and 7 TeV on the “transverse” charged particle density, dN/dhdf, as defined by the leading charged particle (PTmax) for charged particles with pT > 0.5 GeV/c and |h| < 2.5. The data are corrected and compared with PYTHIA Tune DW at the generator level. Rick Field – Florida/CDF/CMS
PYTHIA Tune DW CMS ATLAS • Ratio of the ATLAS preliminary data at 900 GeV and 7 TeV on the “transverse” charged PTsum density, dPT/dhdf, as defined by the leading charged particle (PTmax) for charged particles with pT > 0.5 GeV/c and |h| < 2.5. The data are corrected and compared with PYTHIA Tune DW at the generator level. • Ratio of the CMS preliminary data at 900 GeV and 7 TeV on the “transverse” charged PTsum density, dPT/dhdf, as defined by the leading charged particle jet (chgjet#1) for charged particles with pT > 0.5 GeV/c and |h| < 2. The data are uncorrected and compared with PYTHIA Tune DW after detector simulation. Rick Field – Florida/CDF/CMS
“Transverse” Multiplicity Distribution Same hard scale at two different center-of-mass energies! CMS • CMS uncorrected data at 900 GeV and 7 TeV on the charged particle multiplicity distribution in the “transverse” region for charged particles (pT > 0.5 GeV/c, |h| < 2) as defined by the leading charged particle jet, chgjet#1, with PT(chgjet#1) > 3 GeV/c compared with PYTHIA Tune DW at the detector level (i.e. Theory + SIM). Shows the growth of the “underlying event” as the center-of-mass energy increases. Rick Field – Florida/CDF/CMS
“Transverse” Multiplicity Distribution Same center-of-mass energy at two different hard scales! CMS • CMS uncorrected data at 7 TeV on the charged particle multiplicity distribution in the “transverse” region for charged particles (pT > 0.5 GeV/c, |h| < 2) as defined by the leading charged particle jet, chgjet#1, with PT(chgjet#1) > 3 GeV/c and PT(chgjet#1) > 20 GeV/c compared with PYTHIA Tune DW at the detector level (i.e. Theory + SIM). Shows the growth of the “underlying event” as the hard scale increases. Rick Field – Florida/CDF/CMS
PYTHIA Tune DW How well did we do at predicting the “underlying event” at 900 GeV and 7 TeV? Tune DW Tune DW • I am surprised that the Tunes did not do a better job of predicting the behavior of the “underlying event” at 900 GeV and 7 TeV! Tune DW Rick Field – Florida/CDF/CMS
PYTHIA Tune DW How well did we do at predicting the “underlying event” at 900 GeV and 7 TeV? Tune DW Tune DW • I am surprised that the Tunes did as well as they did at predicting the behavior of the “underlying event” at 900 GeV and 7 TeV! Tune DW Rick Field – Florida/CDF/CMS
UE Summary • The “underlying event” at 7 TeV and 900 GeV is almost what we expected! With a little tuning we should be able to describe the data very well (see Tune Z1 later in this talk). • I am surprised that the Tunes did as well as they did at predicting the behavior of the “underlying event” at 900 GeV and 7 TeV! Remember this is “soft” QCD! PARP(82) PARP(90) • “Min-Bias” is a whole different story! Much more complicated due to diffraction! Color Diffraction Connections Rick Field – Florida/CDF/CMS
UE Summary Warning! All the UE studies look at charged particles with pT > 0.5 GeV/c. We do not know if the models correctly describe the UE at lower pT values! • The “underlying event” at 7 TeV and 900 GeV is almost what we expected! With a little tuning we should be able to describe the data very well. • I am surprised that the Tunes did as well as they did at predicting the behavior of the “underlying event” at 900 GeV and 7 TeV! Remember this is “soft” QCD! PARP(82) PARP(90) • “Min-Bias” is a whole different story! Much more complicated due to diffraction! Color Diffraction Connections Rick Field – Florida/CDF/CMS
Proton-Proton Collisions stot = sEL + sSD+sDD+sHC ND “Inelastic Non-Diffractive Component” The “hard core” component contains both “hard” and “soft” collisions. Rick Field – Florida/CDF/CMS
The Inelastic Non-Diffractive Cross-Section “Semi-hard” parton-parton collision (pT < ≈2 GeV/c) + + + + … Multiple-parton interactions (MPI)! Rick Field – Florida/CDF/CMS
The Inelastic Non-Diffractive Cross-Section Majority of “min-bias” events! “Semi-hard” parton-parton collision (pT < ≈2 GeV/c) + + + + … Multiple-parton interactions (MPI)! Rick Field – Florida/CDF/CMS
The Inelastic Non-Diffractive Cross-Section Occasionally one of the parton-parton collisions is hard (pT > ≈2 GeV/c) Majority of “min-bias” events! “Semi-hard” parton-parton collision (pT < ≈2 GeV/c) + + + + … Multiple-parton interactions (MPI)! Rick Field – Florida/CDF/CMS
The “Underlying Event” Select inelastic non-diffractive events that contain a hard scattering “Semi-hard” parton-parton collision (pT < ≈2 GeV/c) Hard parton-parton collisions is hard (pT > ≈2 GeV/c) The “underlying-event” (UE)! 1/(pT)4→ 1/(pT2+pT02)2 + + + … Given that you have one hard scattering it is more probable to have MPI! Hence, the UE has more activity than “min-bias”. Multiple-parton interactions (MPI)! Rick Field – Florida/CDF/CMS
UE Tunes Allow primary hard-scattering to go to pT = 0 with same cut-off! “Underlying Event” Fit the “underlying event” in a hard scattering process. 1/(pT)4→ 1/(pT2+pT02)2 “Min-Bias” (ND) + + + Predict MB (ND)! + … Rick Field – Florida/CDF/CMS
UE Tunes Allow primary hard-scattering to go to pT = 0 with same cut-off! “Underlying Event” Fit the “underlying event” in a hard scattering process. 1/(pT)4→ 1/(pT2+pT02)2 “Min-Bias” (add single & double diffraction) + + + Predict MB (ND)! + … Rick Field – Florida/CDF/CMS
LHC MB Predictions: 900 GeV • Compares the 900 GeV ALICE data with PYTHIA Tune DW and Tune S320 Perugia 0. Tune DW uses the old Q2-ordered parton shower and the old MPI model. Tune S320 uses the new pT-ordered parton shower and the new MPI model. The numbers in parentheses are the average value of dN/dh for the region |h| < 0.6. Rick Field – Florida/CDF/CMS
LHC MB Predictions: 900 GeV Off by 11%! • Compares the 900 GeV data with PYTHIA Tune DW and Tune S320 Perugia 0. Tune DW uses the old Q2-ordered parton shower and the old MPI model. Tune S320 uses the new pT-ordered parton shower and the new MPI model. The numbers in parentheses are the average value of dN/dh for the region |h| < 0.6. Rick Field – Florida/CDF/CMS
ATLAS INEL dN/dh • None of the tunes fit the ATLAS INEL dN/dh data with PT > 100 MeV! They all predict too few particles. Off by 20-50%! • The ATLAS Tune AMBT1 was designed to fit the inelastic data for Nchg ≥ 6 with pT > 0.5 GeV/c! Soft particles! Rick Field – Florida/CDF/CMS
PYTHIA Tune DW If one increases the hard scale the agreement improves! Tune DW • ALICE inelastic data at 900 GeV on the dN/dh distribution for charged particles (pT > PTmin) for events with at least one charged particle with pT > PTmin and |h| < 0.8 for PTmin = 0.15 GeV/c, 0.5 GeV/c, and 1.0 GeV/c compared with PYTHIA Tune DW at the generator level. The same thing occurs at 7 TeV! ALICE, ATLAS, and CMS data coming soon. Rick Field – Florida/CDF/CMS
PYTHIA Tune DW Diffraction contributes less at harder scales! Tune DW • ALICE inelastic data at 900 GeV on the dN/dh distribution for charged particles (pT > PTmin) for events with at least one charged particle with pT > PTmin and |h| < 0.8 for PTmin = 0.15 GeV/c, 0.5 GeV/c, and 1.0 GeV/c compared with PYTHIA Tune Z1 at the generator level (dashed = ND, solid = INEL). Cannot trust PYTHIA 6.2 modeling of diffraction! Rick Field – Florida/CDF/CMS
CMS dN/dh CMS Tune DW Soft particles! All pT • Generator level dN/dh (all pT). Shows the NSD = HC + DD and the HC = ND contributions for Tune DW. Also shows the CMS NSD data. Off by 50%! Rick Field – Florida/CDF/CMS
CMS dN/dh Okay if the Monte-Carlo does not fit the data what do we do? We tune the Monte-Carlo to fit the data! CMS Tune DW Soft particles! All pT • Generator level dN/dh (all pT). Shows the NSD = HC + DD and the HC = ND contributions for Tune DW. Also shows the CMS NSD data. Off by 50%! Rick Field – Florida/CDF/CMS
CMS dN/dh Okay if the Monte-Carlo does not fit the data what do we do? We tune the Monte-Carlo to fit the data! Be careful not to tune away new physics! CMS Tune DW Soft particles! All pT • Generator level dN/dh (all pT). Shows the NSD = HC + DD and the HC = ND contributions for Tune DW. Also shows the CMS NSD data. Off by 50%! Rick Field – Florida/CDF/CMS
PYTHIA Tune Z1 • All my previous tunes (A, DW, DWT, D6, D6T, CW, X1, and X2) were PYTHIA 6.4 tunes using the old Q2-ordered parton showers and the old MPI model (really 6.2 tunes)! PARP(90) PARP(82) Color • I believe that it is time to move to PYTHIA 6.4 (pT-ordered parton showers and new MPI model)! Connections Diffraction • Tune Z1: I started with the parameters of ATLAS Tune AMBT1, but I changed LO* to CTEQ5L and I varied PARP(82) and PARP(90) to get a very good fit of the CMS UE data at 900 GeV and 7 TeV. • The ATLAS Tune AMBT1 was designed to fit the inelastic data for Nchg ≥ 6 and to fit the PTmax UE data with PTmax > 10 GeV/c. Tune AMBT1 is primarily a min-bias tune, while Tune Z1 is a UE tune! UE&MB@CMS Rick Field – Florida/CDF/CMS
PYTHIA Tune Z1 Parameters not shown are the PYTHIA 6.4 defaults! Rick Field – Florida/CDF/CMS
PYTHIA Tune Z1 CMS CMS Tune Z1 • CMS preliminary data at 900 GeV and 7 TeV on the “transverse” charged particle density, dN/dhdf, as defined by the leading charged particle jet (chgjet#1) for charged particles with pT > 0.5 GeV/c and |h| < 2.0. The data are uncorrected and compared with PYTHIA Tune DW and D6T after detector simulation (SIM). • CMS preliminary data at 900 GeV and 7 TeV on the “transverse” charged particle density, dN/dhdf, as defined by the leading charged particle jet (chgjet#1) for charged particles with pT > 0.5 GeV/c and |h| < 2.0. The data are uncorrected and compared with PYTHIA Tune Z1 after detector simulation (SIM). Tune Z1 (CTEQ5L) PARP(82) = 1.932 PARP(90) = 0.275 PARP(77) = 1.016 PARP(78) = 0.538 Color reconnection suppression. Color reconnection strength. Tune Z1 is a PYTHIA 6.4 using pT-ordered parton showers and the new MPI model! Rick Field – Florida/CDF/CMS
PYTHIA Tune Z1 CMS CMS Tune Z1 • CMS preliminary data at 900 GeV and 7 TeV on the “transverse” charged PTsum density, dPT/dhdf, as defined by the leading charged particle jet (chgjet#1) for charged particles with pT > 0.5 GeV/c and |h| < 2.0. The data are uncorrected and compared with PYTHIA Tune DW and D6T after detector simulation (SIM). • CMS preliminary data at 900 GeV and 7 TeV on the “transverse” charged PTsum density, dPT/dhdf, as defined by the leading charged particle jet (chgjet#1) for charged particles with pT > 0.5 GeV/c and |h| < 2.0. The data are uncorrected and compared with PYTHIA Tune Z1 after detector simulation (SIM). Tune Z1 (CTEQ5L) PARP(82) = 1.932 PARP(90) = 0.275 PARP(77) = 1.016 PARP(78) = 0.538 Color reconnection suppression. Color reconnection strength. Tune Z1 is a PYTHIA 6.4 using pT-ordered parton showers and the new MPI model! Rick Field – Florida/CDF/CMS
PYTHIA Tune Z1 ATLAS ATLAS Tune Z1 Tune Z1 • ATLAS preliminary data at 900 GeV and 7 TeV on the “transverse” charged particle density, dN/dhdf, as defined by the leading charged particle (PTmax) for charged particles with pT > 0.5 GeV/c and |h| < 2.5. The data are corrected and compared with PYTHIA Tune Z1 at the generator level. • ATLAS preliminary data at 900 GeV and 7 TeV on the “transverse” charged PTsum density, dPT/dhdf, as defined by the leading charged particle (PTmax) for charged particles with pT > 0.5 GeV/c and |h| < 2.5. The data are corrected and compared with PYTHIA Tune Z1 at the generrator level. Tune Z1 (CTEQ5L) PARP(82) = 1.932 PARP(90) = 0.275 PARP(77) = 1.016 PARP(78) = 0.538 Color reconnection suppression. Color reconnection strength. Tune Z1 is a PYTHIA 6.4 using pT-ordered parton showers and the new MPI model! Rick Field – Florida/CDF/CMS
PYTHIA Tune Z1 Tune Z1 CMS CMS • Ratio of CMS preliminary data at 900 GeV and 7 TeV (7 TeV divided by 900 GeV) on the “transverse” charged particle density as defined by the leading charged particle jet (chgjet#1) for charged particles with pT > 0.5 GeV/c and |h| < 2.0. The data are uncorrected and compared with PYTHIA Tune DW, D6T, CW, and P0 after detector simulation (SIM). • Ratio of CMS preliminary data at 900 GeV and 7 TeV (7 TeV divided by 900 GeV) on the “transverse” charged particle density as defined by the leading charged particle jet (chgjet#1) for charged particles with pT > 0.5 GeV/c and |h| < 2.0. The data are uncorrected and compared with PYTHIA Tune Z1 after detector simulation (SIM). Rick Field – Florida/CDF/CMS
PYTHIA Tune Z1 Tune Z1 CMS CMS • Ratio of CMS preliminary data at 900 GeV and 7 TeV (7 TeV divided by 900 GeV) on the “transverse” charged PTsum density as defined by the leading charged particle jet (chgjet#1) for charged particles with pT > 0.5 GeV/c and |h| < 2.0. The data are uncorrected and compared with PYTHIA Tune DW, D6T, CW, and P0 after detector simulation (SIM). • Ratio of CMS preliminary data at 900 GeV and 7 TeV (7 TeV divided by 900 GeV) on the “transverse” charged PTsum density as defined by the leading charged particle jet (chgjet#1) for charged particles with pT > 0.5 GeV/c and |h| < 2.0. The data are uncorrected and compared with PYTHIA Tune Z1 after detector simulation (SIM). Rick Field – Florida/CDF/CMS
PYTHIA Tune Z1 Tune Z1 Tune Z1 ATLAS ATLAS • Ratio of the ATLAS preliminary data on the charged particle density in the “transverse” region for charged particles (pT > 0.5 GeV/c, |h| < 2.5) at 900 GeV and 7 TeVas defined by PTmax compared with PYTHIA Tune Z1 at the generator level. • Ratio of the ATLAS preliminary data on the charged PTsum density in the “transverse” region for charged particles (pT > 0.5 GeV/c, |h| < 2.5) at 900 GeV and 7 TeVas defined by PTmax compared with PYTHIA Tune Z1 at the generator level. Rick Field – Florida/CDF/CMS
“Transverse” Multiplicity Distribution CMS CMS Tune Z1 • CMS uncorrected data at 900 GeV and 7 TeV on the charged particle multiplicity distribution in the “transverse” region for charged particles (pT > 0.5 GeV/c, |h| < 2) as defined by the leading charged particle jet with PT(chgjet#1) > 3 GeV/c compared with PYTHIA Tune Z1 at the detector level (i.e. Theory + SIM). • CMS uncorrected data at 900 GeV and 7 TeV on the charged particle multiplicity distribution in the “transverse” region for charged particles (pT > 0.5 GeV/c, |h| < 2) as defined by the leading charged particle jet with PT(chgjet#1) > 3 GeV/c compared with PYTHIA Tune DW and Tune D6T at the detector level (i.e. Theory + SIM). Rick Field – Florida/CDF/CMS
“Transverse” PTsum Distribution CMS CMS Tune Z1 • CMS uncorrected data at 900 GeV and 7 TeV on the charged scalar PTsum distribution in the “transverse” region for charged particles (pT > 0.5 GeV/c, |h| < 2) as defined by the leading charged particle jet with PT(chgjet#1) > 3 GeV/c compared with PYTHIA Tune DW,andTune D6T at the detector level (i.e. Theory + SIM). • CMS uncorrected data at 900 GeV and 7 TeV on the charged scalar PTsum distribution in the “transverse” region for charged particles (pT > 0.5 GeV/c, |h| < 2) as defined by the leading charged particle jet with PT(chgjet#1) > 3 GeV/c compared with PYTHIA Tune Z1,at the detector level (i.e. Theory + SIM). Rick Field – Florida/CDF/CMS
“Transverse” Multiplicity Distribution CMS CMS Tune Z1 • CMS uncorrected data at 7 TeV on the charged particle multiplicity distribution in the “transverse” region for charged particles (pT > 0.5 GeV/c, |h| < 2) as defined by the leading charged particle jet with PT(chgjet#1) > 3 GeV/c and PT(chgjet#1) > 20 GeV/c compared with PYTHIA Tune Z1 at the detector level (i.e. Theory + SIM). • CMS uncorrected data at 7 TeV on the charged particle multiplicity distribution in the “transverse” region for charged particles (pT > 0.5 GeV/c, |h| < 2) as defined by the leading charged particle jet with PT(chgjet#1) > 3 GeV/c and PT(chgjet#1) > 20 GeV/c compared with PYTHIA Tune DW and Tune D6T at the detector level (i.e. Theory + SIM). Rick Field – Florida/CDF/CMS
“Transverse” Multiplicity Distribution Difficult to produce enough events with large “transverse” multiplicity at low hard scale! Tune Z1 CMS • CMS uncorrected data at 7 TeV on the charged particle multiplicity distribution in the “transverse” region for charged particles (pT > 0.5 GeV/c, |h| < 2) as defined by the leading charged particle jet, chgjet#1, with PT(chgjet#1) > 3 GeV/c and PT(chgjet#1) > 20 GeV/c compared with PYTHIA Tune Z1 at the detector level (i.e. Theory + SIM). Rick Field – Florida/CDF/CMS
“Transverse” PTsum Distribution CMS CMS Tune Z1 • CMS uncorrected data at 7 TeV on the charged PTsum distribution in the “transverse” region for charged particles (pT > 0.5 GeV/c, |h| < 2) as defined by the leading charged particle jet with PT(chgjet#1) > 3 GeV/c and PT(chgjet#1) > 20 GeV/c compared with PYTHIA Tune Z1 at the detector level (i.e. Theory + SIM). • CMS uncorrected data at 7 TeV on the charged PTsum distribution in the “transverse” region for charged particles (pT > 0.5 GeV/c, |h| < 2) as defined by the leading charged particle jet with PT(chgjet#1) > 3 GeV/c and PT(chgjet#1) > 20 GeV/c compared with PYTHIA Tune DW and Tune D6T at the detector level (i.e. Theory + SIM). Rick Field – Florida/CDF/CMS
“Transverse” PTsum Distribution Difficult to produce enough events with large “transverse” PTsum at low hard scale! Tune Z1 CMS • CMS uncorrected data at 7 TeV on the charged PTsum distribution in the “transverse” region for charged particles (pT > 0.5 GeV/c, |h| < 2) as defined by the leading charged particle jet, chgjet#1, with PT(chgjet#1) > 3 GeV/c and PT(chgjet#1) > 20 GeV/c compared with PYTHIA Tune Z1 at the detector level (i.e. Theory + SIM). Rick Field – Florida/CDF/CMS