Download
1 / 16
160 likes | 359 Views
7. Expectations and the Phillips Curve. Exogenous business cycle explanation rational expectations resulted from critique of Phillips curve extreme results in theory substantial impact on economic thought.

E N D
7. Expectations and the Phillips Curve • Exogenousbusinesscycleexplanation • rational expectations • resultedfromcritiqueof Phillips curve • extreme results in theory • substantial impact on economicthought Konjunktur und Beschäftigung U. van Suntum KuB 6 1 U van Suntum, Lecture KuB 1
Phillipscurve and Expectations Lucas supply function:*) • Robert E. Lucas jr. • born 1937 • Nobelprize 1995 Konjunktur und Beschäftigung U. van Suntum KuB 6 2 U van Suntum, Lecture KuB 2
Business cycle modell with Lucas supply function • With p = pe and u = 0 => Yreal = Yreal* • p endogenous, dependent on pe Konjunktur und Beschäftigung U. van Suntum KuB 6 3 U van Suntum, Lecture KuB 3
Three versions of expectations: a) static (Keynesian version ): b) adaptive (monetaristic version): With it follows: c) rational (new classical version): Konjunktur und Beschäftigung U. van Suntum KuB 6 4 U van Suntum, Lecture KuB 4
Nine possible combinations with monetary policy (six are relevant): Konjunktur und Beschäftigung U. van Suntum KuB 6 5 U van Suntum, Lecture KuB 5
Konjunktur und Beschäftigung U. van Suntum KuB 6 6 U van Suntum, Lecture KuB 6
Numerical example model Ab: one-off increase of M with adaptive expectations*) Neuklassisches Konjunkturmodell.xls Konjunktur und Beschäftigung U. van Suntum KuB 6 7 U van Suntum, Lecture KuB 7
Phillipscurve in model Ab: Konjunktur und Beschäftigung U. van Suntum KuB 6 8 U van Suntum, Lecture KuB 8
Numerical example model Ab: constant growth rate of M with adaptive expectations* Neuklassisches Konjunkturmodell.xls Konjunktur und Beschäftigung U. van Suntum KuB 6 9 U van Suntum, Lecture KuB 9
Phillipscurve in modelBb: Konjunktur und Beschäftigung U. van Suntum KuB 6 10 U van Suntum, Lecture KuB 10
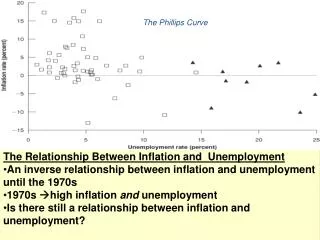
Phillipscurve in Germany 1973 – 2001(I) Inflation rate Unemployment rate year Konjunktur und Beschäftigung U. van Suntum KuB 6 11 U van Suntum, Lecture KuB 11
Phillipscurve in Germany 1973 – 2001 (II) inflation rate Unemployment rate Konjunktur und Beschäftigung U. van Suntum KuB 6 12 U van Suntum, Lecture KuB 12
Phillipscurve in Germany 1973 – 2001 (III) inflation rate Unemployment rate Konjunktur und Beschäftigung U. van Suntum KuB 6 13 U van Suntum, Lecture KuB 13
Phillipscurve in Germany 1973 – 2001 (IV) 1970s 1980s 1990s inflation rate Unemployment rate Konjunktur und Beschäftigung U. van Suntum KuB 6 14 U van Suntum, Lecture KuB 14
Strengths: Role of expectations is highlighted Different versions of Phillips curve can be explained Simultanous explanation of inflation and business cycle Weaknesses: Rational expectations not a realistic assumption Money supply exongenous? One-sided Criticism of new classical theory Konjunktur und Beschäftigung U. van Suntum KuB 6 15 U van Suntum, Lecture KuB 15
What is a Lucas supply function? What kinds of expectations can be distiguished? What is the impact of different combinations of monetary policy and expectations on the Phillips curve? What are the key drivers for fluctuations in new classical theory? Learning goals/Questions Konjunktur und Beschäftigung U. van Suntum KuB 6 16 U van Suntum, Lecture KuB 16