Download
1 / 7
100 likes | 390 Views
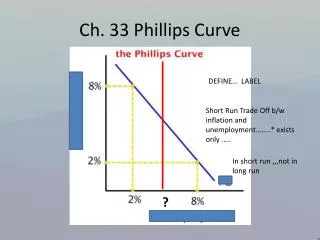
The Phillips Curve. Inverse relationship Unemployment rate Rate of change in nominal wages (inflation) Short-run Phillips curve Long-run Phillips curve. LO 4. Exhibit 5. LO 4. Hypothetical Phillips Curve. c. b. a. d.

E N D
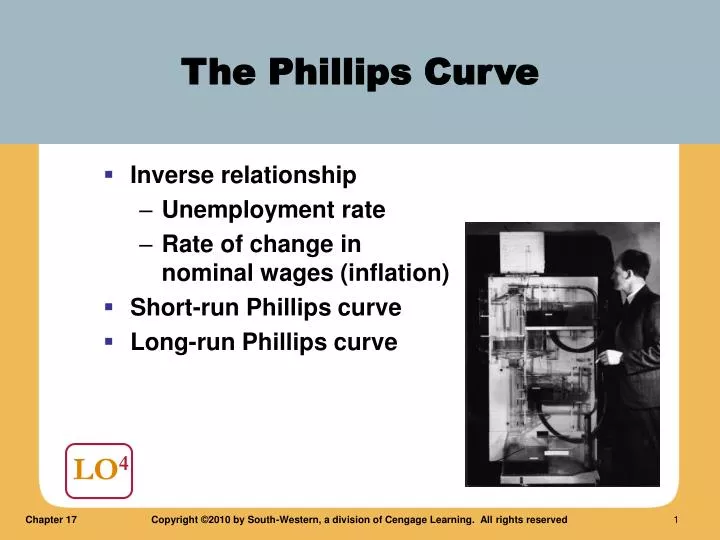
The Phillips Curve • Inverse relationship • Unemployment rate • Rate of change in nominal wages (inflation) • Short-run Phillips curve • Long-run Phillips curve LO4
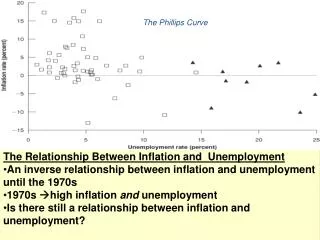
Exhibit 5 LO4 Hypothetical Phillips Curve c b a d The Phillips curve shows an inverse relation between unemployment and inflation. Points a and b lie on the Phillips curve and represent alternative combinations of inflation and unemployment that are attainable as long as the curve itself does not shift. Points c and d are off the curve. Inflation rate (percent change in price level) 10 5 Phillips curve Unemployment rate (percent) 0 5 10
The Short-Run Phillips Curve • Short-run Phillips curve • Labor contracts • Given price level • Given expected inflation • Inflation – as expected • Unemployment = natural rate • Inflation > expected • Unemployment < natural rate • Inflation < expected • Unemployment < natural rate LO4
Exhibit 6 LO4 Aggregate Supply Curve and Phillips Curves in the Short Run and Long Run Potential output Long-run Phillips curve b c c e LRAS Price level a a b d d e SRAS103 5 105 Inflation rate (percent) 3 103 1 101 Short-run Phillips curve AD” AD’ AD Unemployment rate (percent) Real GDP 0 13.9 14.0 14.1 0 4 6 5 Expected price level=103 (3% higher than current level) and AD; actual price level=103; potential output; point a; unemployment=natural rate=5% If AD > expected (AD'): price level=105 > expected; output>potential; higher inflation; lower unemployment. If AD<expected: (AD“); price level=101<expected; output<potential; lower inflation; higher unemployment.
The Long-Run Phillips Curve • Long-run Phillips curve • Vertical line • Economy’s natural rate of unemployment • Workers and employers • Fully adjust to unexpected changes in AD • Long run, for flexible prices and wages • Unemployment • Independent of inflation LO4
The Natural Rate Hypothesis • Long run • Natural rate of unemployment • Independent of AD stimulus • Fiscal policy • Monetary policy • Optimal policy in long run • Results in low inflation LO4
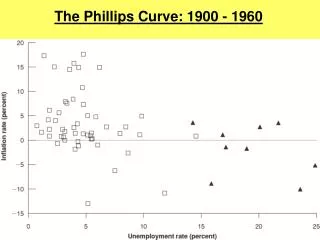
LO4 Short-Run Phillips Curves Since 1960 Exhibit 7