Download
1 / 49
490 likes | 506 Views
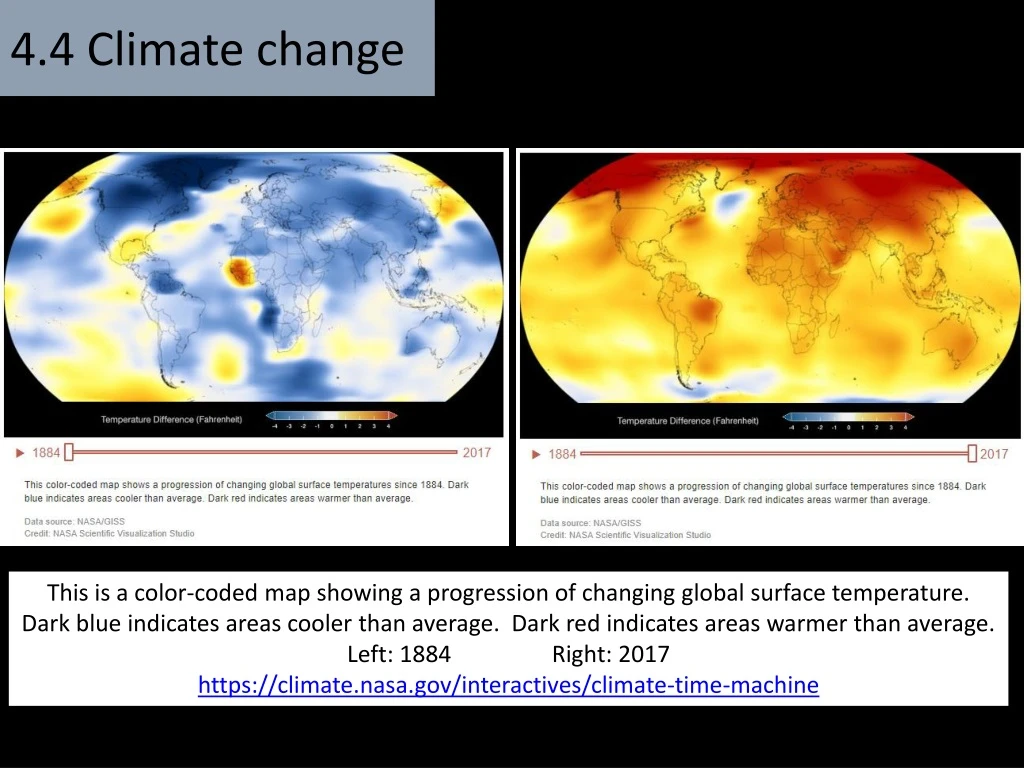
This color-coded map shows the progression of changing global surface temperature from 1884 to 2017. Dark blue indicates cooler areas, while dark red indicates warmer areas than the average. Explore the interactive map to understand the impact of climate change.

E N D
4.4 Climate change This is a color-coded map showing a progression of changing global surface temperature. Dark blue indicates areas cooler than average. Dark red indicates areas warmer than average. Left: 1884 Right: 2017 https://climate.nasa.gov/interactives/climate-time-machine
4.4 • Essential idea: Concentrations of gases in the atmosphere affect climates experienced at the Earth’s surface.
What is this graph showing? What event in history began contributing to this trend? https://climate.nasa.gov/evidence/
Weather vs. Global Warming vs. Climate Change • What do these words mean??? • Weather = atmospheric conditions that occur locally over short periods of time—from minutes to hours or days
Weather vs. Global Warming vs. Climate Change • Global Warming = the long-term warming of the planet since the early 20th century, and most notably since the late 1970s, due to the increase in fossil fuel emissions since the Industrial Revolution “The graph shows average annual global temperatures since 1880 compared to the long-term average (1901-2000). The zero line represents the long-term average temperature for the whole planet, blue and red bars show the difference above or below average for each year.” https://www.climate.gov/news-features/understanding-climate/climate-change-global-temperature
Weather vs. Global Warming vs. Climate Change • Climate Change = a broad range of global phenomena created predominantly by burning fossil fuels, which add heat-trapping gases to Earth’s atmosphere; phenomena includes increased temperature trends, changes such as sea level rise, ice mass loss in Greenland, Antarctica, the Arctic and mountain glaciers worldwide, shifts in flower/plant blooming, and extreme weather events. https://climate.nasa.gov/evidence/
4.4.U1 Carbon dioxide and water vapour are the most significant greenhouse gases.4.4.U2 Other gases including methane and nitrogen oxides have less impact. The Earth is kept much warmer by gases in the atmosphere that retain heat. These gases are referred to as greenhouses gases. • The greenhouse gases that have the largest warming effect on the Earth are: • (below) • (e.g. clouds) Other gases, including and,have less impact. Nitrogen oxides arereleased naturally by bacteria in some habitats and also by agriculture and vehicle exhausts. Greenhouse gases together make up less than 1% of the atmosphere. http://news.bbc.co.uk/2/shared/spl/hi/sci_nat/04/climate_change/html/greenhouse.stm http://commons.wikimedia.org/wiki/File:GoldenMedows.jpg
4.4.U1 Carbon dioxide and water vapour are the most significant greenhouse gases.4.4.U2 Other gases including methane and nitrogen oxides have less impact. The Earth is kept much warmer by gases in the atmosphere that retain heat. These gases are referred to as greenhouses gases. Q – why is the surface of the Earth warmer at night if there is cloud cover? http://commons.wikimedia.org/wiki/File:GoldenMedows.jpg
4.4.U1 Carbon dioxide and water vapour are the most significant greenhouse gases.4.4.U2 Other gases including methane and nitrogen oxides have less impact. The Earth is kept much warmer by gases in the atmosphere that retain heat. These gases are referred to as greenhouses gases. Q – why is the surface of the Earth warmer at night if there is cloud cover? The water droplets in clouds retain heat during the day and at night re-radiate the heat back to the surface http://commons.wikimedia.org/wiki/File:GoldenMedows.jpg
4.4.U1 Carbon dioxide and water vapour are the most significant greenhouse gases.4.4.U2 Other gases including methane and nitrogen oxides have less impact. The Earth is kept much warmer by gases in the atmosphere that retain heat. These gases are referred to as greenhouses gases. Q – why is the surface of the Earth warmer at night if there is cloud cover? The water droplets in clouds retain heat during the day and at night re-radiate the heat back to the surface Q – why is the surface of the Earth cooler when there is more cloud coverage. http://commons.wikimedia.org/wiki/File:GoldenMedows.jpg
4.4.U1 Carbon dioxide and water vapour are the most significant greenhouse gases.4.4.U2 Other gases including methane and nitrogen oxides have less impact. The Earth is kept much warmer by gases in the atmosphere that retain heat. These gases are referred to as greenhouses gases. Q – why is the surface of the Earth warmer at night if there is cloud cover? The water droplets in clouds retain heat during the day and at night re-radiate the heat back to the surface Q – why is the surface of the Earth cooler during the day when there is more cloud coverage? The water droplets in clouds reflect a range of different wavelengths of radiation in both directions (including radiation coming inward that would have been re-emitted as heat*). *Although clouds make the surface of the Earth cooler in the short term, they do not stop the greenhouse effect, it is just delayed or slowed down. http://commons.wikimedia.org/wiki/File:GoldenMedows.jpg
4.4.U3The impact of a gas depends on its ability to absorb long wave radiation as well as on its concentration in the atmosphere. impact of a greenhouse gas depends on Ability to absorb long-wave radiation (especially infrared/heat) abundance in the atmosphere http://commons.wikimedia.org/wiki/File:GoldenMedows.jpg
4.4.U3The impact of a gas depends on its ability to absorb long wave radiation as well as on its concentration in the atmosphere. impact of a greenhouse gas Ability to absorb long-wave radiation (especially infrared/heat) abundance in the atmosphere is determined by: rate of release persistence http://commons.wikimedia.org/wiki/File:GoldenMedows.jpg
4.4.U3The impact of a gas depends on its ability to absorb long wave radiation as well as on its concentration in the atmosphere. impact of a greenhouse gas Ability to absorb long-wave radiation (especially infrared/heat) abundance in the atmosphere CO2 is very abundant making up 400 ppm by volume of the atmosphere (0.04%) Methane has 33 times the effect of CO2(but is not very abundant) rate of release persistence Water vapour enters the atmosphere very rapidly, but only remains for days whereas CO2 persists for years. http://commons.wikimedia.org/wiki/File:GoldenMedows.jpg
4.4.U4The warmed Earth emits longer wavelength radiation (heat).4.4.U5 Longer wave radiation is absorbed by greenhouse gases that retain the heat in the atmosphere. How the greenhouse effectworks This is a good slide to know! Approx. 25% of solar radiation is absorbed by the atmosphere. 1 2 Approx. 75% of solar radiation penetrates the atmosphere and reaches the Earth’s surface. 4 Up to 85%* of re-emitted heat is captured by greenhouse gases in the atmosphere. 5 3 Heat passes back to the surface of the Earth, causing warming The surface of the Earth absorbs short-wave solar energy (UV) and re-emits at longer wavelengths (as heat). *This value, though variable, is known to be rising; very likely the result of human activities. http://www.sumanasinc.com/webcontent/animations/content/globalcarboncycle.html
4.4.U4The warmed Earth emits longer wavelength radiation (heat).4.4.U5 Longer wave radiation is absorbed by greenhouse gases that retain the heat in the atmosphere. How the greenhouse effectworks Approx. 25% of solar radiation is absorbed by the atmosphere. 1 If the Earth had no atmosphere, and hence no greenhouse effect, the average surface temperature would be approx. -18oC. Suggest the impact to life on Earth if this occurred. 2 Approx. 75% of solar radiation penetrates the atmosphere and reaches the Earth’s surface. 4 Up to 85%* of re-emitted heat is captured by greenhouse gases in the atmosphere. Ex: A comfortable 70 F would be 41 F with a decrease of 16C 5 3 Heat passes back to the surface of the Earth, causing warming The surface of the Earth absorbs short-wave solar energy and re-emits at longer wavelengths (as heat). *This value, though variable, is known to be rising; very likely the result of human activities. http://www.sumanasinc.com/webcontent/animations/content/globalcarboncycle.html
4.4.U4The warmed Earth emits longer wavelength radiation (heat).4.4.U5 Longer wave radiation is absorbed by greenhouse gases that retain the heat in the atmosphere. How the greenhouse effectworks (this diagram quantifies the effect in Watts / m2) http://commons.wikimedia.org/wiki/File:The_green_house_effect.svg
4.4.U4The warmed Earth emits longer wavelength radiation (heat).4.4.U5 Longer wave radiation is absorbed by greenhouse gases that retain the heat in the atmosphere. How the greenhouse effectworks Use the animations/tutorials to improve your understanding and find out more. http://www.sumanasinc.com/webcontent/animations/content/greenhouse.html http://www.sumanasinc.com/webcontent/animations/content/globalcarboncycle.html http://news.bbc.co.uk/2/shared/spl/hi/sci_nat/04/climate_change/html/greenhouse.stm
4.4.U7There is a correlation between rising atmospheric concentrations of carbon dioxide since the start of the industrial revolution 200 years ago and average global temperatures. Evidence for a correlationbetween atmospheric carbon dioxide(CO2) and average global temperatures • Key points • global temperatures show large variations (for various reasons) • (despite this) there is strong support for correlation between atmospheric carbon dioxide and global temperatures http://oceanworld.tamu.edu/resources/oceanography-book/co2problem.htm
4.4.A2 Correlations between global temperatures and carbon dioxide concentrations on Earth. To deduce historic carbon dioxide concentrations and temperatures ice cores are drilled in Antarctic ice sheets Vostock ice core (pictured) drilled at a Russian monitoring station in East Antarctica is an example of an ice core. A cylinder of ice was collected by drilling to the bottom of the Antarctic ice sheet. The total length of the core was 2083 meters. The core . Analysis of the gas content of the bubbles gives both the (from oxygen isotopes) at the time ice was formed. http://en.wikipedia.org/wiki/File:GISP2_team_photo_core37.jpeg http://commons.wikimedia.org/wiki/File:GISP2_1855m_ice_core_layers.png
4.4.A2 Correlations between global temperatures and carbon dioxide concentrations on Earth. Evidence for a correlationbetween atmospheric carbon dioxide(CO2) and average global temperatures • Key points • The correlation is supported by ice core data over the last 400,000 years • Temperature shows greater variation than CO2 • Most, but not all • The same trend has been found in other ice cores. n.b.Vostock is a Russian monitoring station in East Antarctica http://oceanworld.tamu.edu/resources/oceanography-book/co2problem.htm
4.4.A2 Correlations between global temperatures and carbon dioxide concentrations on Earth. Evidence for a correlationbetween atmospheric carbon dioxide(CO2) and average global temperatures • Key points • The correlation is supported by ice core data over the last 400,000 years • Temperature shows greater variation than CO2 • Most, but not all rises and falls in CO2 have correlated with temperature rises and falls • The same trend has been found in other ice cores. Correlation does not prove causation, but in this case we know from other research that carbon dioxide is a greenhouse gas. n.b.Vostock is a Russian monitoring station in East Antarctica http://oceanworld.tamu.edu/resources/oceanography-book/co2problem.htm
4.4.U8Recent increases in atmospheric carbon dioxide are largely due to increases in the combustion of fossilized organic matter. The link between human emissions and atmospheric levels of CO2 • Key points • There is a strong correlationbetween • As atmospheric CO2 levels have increased, the amount of CO2absorbed by carbon sinks has increased (only about 40% of emissions have remained in the atmosphere) anthropogenic = human caused Large increases in usage of fossil fuels Industrial revolution has started http://radioviceonline.com/wp-content/uploads/2009/11/knorr2009_co2_sequestration.pdf
Play: https://youtu.be/fJ0o2E4d8Ts https://youtu.be/SOTtX16f61w
4.4.U6Global temperatures and climate patterns are influenced by concentrations of greenhouse gases. Global average temperatures are not directly proportional to greenhouse gas concentrations. Other factors, e.g. sun spot activity, have an impact global average temperatures • increases in greenhouse gas concentrations will likely cause: • higher global average temperatures • more frequent and intense heat waves • some areas becoming more prone to droughts • some areas more prone to intense periods of rainfall and flooding • tropical storms to be more frequent and more powerful • Changes to ocean currents, e.g. weakening of the Gulf Stream would mean colder temperatures in north-west Europe http://commons.wikimedia.org/wiki/File:Hurricane_Elena.jpg
4.4.A1 Threats to coral reefs from increasing concentrations of dissolved carbon dioxide. Ocean acidification– the causes and effects Research indicates that, by 2100 coral reefs may erode faster than they can be rebuilt. This could compromise the viability of these ecosystems and the (estimated) one million species that depend on coral reef habitat. http://www.pmel.noaa.gov/co2/story/What+is+Ocean+Acidification%3F http://youtu.be/5cqCvcX7buo http://www.sumanasinc.com/webcontent/animations/content/acidification.html http://youtu.be/Wo-bHt1bOsw http://youtu.be/GL7qJYKzcsk Play
4.4.A1 Threats to coral reefs from increasing concentrations of dissolved carbon dioxide. Ocean acidification– the causes and effects The ocean absorbs about 25% of the CO2emitted into the atmosphere. Therefore as Since 1800 the pH of seawater* has fallen by 0.1 pH units. Since the pH scale is logarithmic, this represents approx. a 30% increase in acidity. Estimates of future CO2 levels, indicate that by 2100 seawater could be nearly 150% more acidic (a further decrease of 0.5 pH) to a level not seen for more than 20 million years. *seawater refers to the surface of oceans which are affected more than the depths. http://pmel.noaa.gov/co2/files/hitimeseries2.jpg
4.4.A1 Threats to coral reefs from increasing concentrations of dissolved carbon dioxide. Ocean acidification– the causes and effects It is not just the creation of carbonic acid that affects pH; when • When CO2 dissolves in water it forms a variety of molecules: • dissolved free CO2 • carbonic acid (H2CO3) • bicarbonate (HCO−3) • carbonate (CO32−) Carbonate ions are , therefore the concentration in seawater is low. Dissolved CO2further. SEE NEXT SLIDE FOR HOW! http://www.pmel.noaa.gov/co2/files/oareaction_med.jpg
4.4.A1 Threats to coral reefs from increasing concentrations of dissolved carbon dioxide. Ocean acidification– the causes and effects The pteropodis a tiny sea creature about the size of a small pea. Pteropods are a major food source for many animals including North Pacific juvenile salmon. The photos below show what happens to a pteropod’s shell when placed in sea water with pH and carbonate levels projected for the year 2100. *Shelled organisms are often keystone species and therefore the entire food web may also be at risk. http://www.pmel.noaa.gov/co2/story/What+is+Ocean+Acidification%3F
More consequences of global warming: • Warmer ocean temperatures and intense ocean acidification can lead to the death of algae that live symbiotically with coral leading to coral bleaching. • Sea levels will rise as polar ice caps and glaciers melt – flood coastal cities and wetlands (breeding grounds for many species of bird, fish, shrimp, crabs – may become extinct) • Shift in global distribution of temps and rainfall – possibly leading to disruption of agriculture • May have profound affect on distribution of tree species – may wipe out hardwood forests of eastern US • May increase tropical disease-carrying organisms like mosquitoes
Should we act??? • The Precautionary principle: • Says that should be taken now to reduce carbon emissions and greenhouse gas production before it is too late (Better safe than sorry!) • Those who wish to continue producing excess greenhouse gases should
Some people argue against measures to combat global warming because there is no absolute proof that the greenhouse effect is harmful • Counter argument is that by the time there is proof, there will have already been catastrophic consequences to the environment
4.4.A3 Evaluating claims that human activities are not causing climate change. Many claims that human activities are not causing climate change have been made in the media, whether it be in newspapers, on television or on the internet. It is important to realize that not all sources are trustworthy and it is important to know the motivation of those publishing claims on either side of the debate. https://www.huffingtonpost.com/entry/scientists-take-on-great-barrier-reef-obituary_us_57fff8f1e4b0162c043b068f https://youtu.be/qN5L2q6hfWo http://www.skepticalscience.com/
Other ways humans are impacting ecosystems: • Biological magnification: process by which – ex. DDT
DDT was one of the first pesticides and was thought to be harmless. However: • DDT is harmful because: • Decomposers cannot readily break it down into harmless substances (not biodegradable) • It is fat soluble (not water soluble) and tends to accumulate in the fatty tissues of animals
Because of inefficient energy transfer between trophic levels, herbivores eat large quantities of plant material, carnivores eat larger amounts of herbivores, etc. leading to biological magnification • Higher trophic levels (top carnivores)have highest concentrations in their tissues • DDT continues to accumulate in predator’s body throughout it’s life
Pollution Magnification of DDT Concentration
Pollution Magnification of DDT Concentration
Pollution Magnification of DDT Concentration
Pollution Magnification of DDT Concentration
Pollution Magnification of DDT Concentration
Pollution Magnification of DDT Concentration
The widespread use of DDT threatened populations of many animals—especially fish-eating birds like the bald eagle—with extinction. • Their eggs were so fragile they did not survive. • By the early 1970s, DDT was banned in the U.S. and in most other industrialized countries; as a result, affected bird populations have recovered.
Acid rain • As humans have moved toward using fossil fuels for energy, acid rain has become a major global issue (in addition to global warming) • The US discharges 30 million tons of sulfur dioxide into the atmosphere each year • 90% of sulfur dioxide in atmosphere comes from human industrial activities • Nitrogen oxide is also released from vehicles, power plants and industry
Acid often falls hundreds or thousands of miles away (pollutants carried by the wind) dissolved in rain (snow, fog) or as microscopic dry particles http://www.dec.ny.gov/chemical/8418.html
Acid eats away statues, buildings, damages trees and crops, kills life in lakes • Lakes become too acid to support life • Acid rain washes away essential nutrients and kills microbes that recycle nutrients • Toxic metals (aluminum, lead, mercury, cadmium) dissolve easier in acid rain and run into lakes and streams – accumulates in fish leading to biological magnification