Download
1 / 17
170 likes | 246 Views
EO001 283510 2/14. | 1. Major goals are expensive. The average consumer over age 65 spends $40,140 annually. Over 20 years with inflation, that ’ s $1,091,331 *. Retirement. Four years at a public university costs $73,564 **. College. Long-term inflation averages 2.8% per year †.

E N D
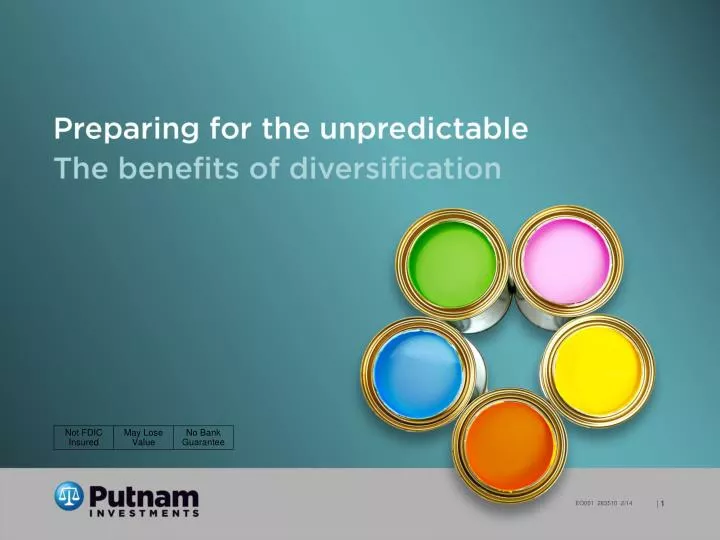
Major goals are expensive The average consumer over age 65 spends $40,140 annually. Over 20 years with inflation, that’s $1,091,331* Retirement Four years at a public university costs $73,564** College Long-term inflation averages 2.8% per year† Wealth preservation * Putnam research, using U.S. Dept. of Labor, Consumer Expenditure 2012 (September 2013). ** The College Board, Trends in College Pricing, 2013-14, based on annual total charges for in-state students at public institutions. † U.S. Bureau of Labor Statistics, Consumer Price Index annual average for the period 12/31/82–12/31/13.
Investing can help Returns for asset classes1983–2013 11.1% 9.4% 8.3% 6.6% 4.0% Returns after 2.80% inflation 1.2% Cash Bonds Stocks Source: Morningstar, 2013. Returns and inflation are annualized for the period 12/31/82–12/31/13. Stocks are represented by the Ibbotson S&P 500 Total Return Index. Bonds are represented by the Ibbotson U.S. Long-Term Government Bond Total Return Index. Cash is represented by the Ibbotson U.S. 30-day Treasury Bill Total Return Index. Inflation is represented by the Consumer Price Index. All indexes are unmanaged and measure broad sectors of the stock and bond markets. You cannot invest directly in an index. Past performance is not indicative of future results.
Be ready for changing markets History shows market leadership changes Annual returns for key indexes (2003–2013) ranked in order of performance (highest to lowest) Highestreturn Lowestreturn The examples are for illustrative purposes only and do not reflect average annualized returns or the performance of any Putnam fund, which will fluctuate. Data are historical. Past performance is not a guarantee of future results. All indexes are unmanaged and measure common sectors of global asset markets. Securities in the indexes do not match those in Putnam funds, and performance will differ. Securities indexes assume reinvestment of distributions and interest payments, and do not take into account brokerage fees and taxes. It is not possible to invest directly in an index.
Asset allocation makes sense Consistent diversification across multiple asset classes outperformed other strategies $10,000 invested annually from 2003 to 2013 • Diversification helps solve the volatility problem • Over time, diversifying across several asset classes may be the most effective strategy for accumulating wealth Staying in cash $105,975 Average annual total return: 1.05% Investing with the losers Investing in last year’s worst-performing asset class $121,562 Average annual total return: 3.52% Chasing the winners Investing in last year’s best-performing asset class $138,497 Average annual total return: 5.84% Asset allocation* Investing consistently across several asset classes $143,240 Average annual total return: 6.44% * Rebalanced annually. Asset classes shown in the tile chart and the performance comparison bar chart are represented by 11 indexes. The asset allocation scenario is based on investments evenly distributed across these asset classes. The risk allocation scenario is based on the following weightings: 30% TIPS, 25% U.S. bonds, 25% international bonds, 15% high-yield bonds, 5% emerging-market bonds, 5% REITs, 15% U.S. stocks, 10% international stocks, 5% emerging-market stocks, 15% commodities, and, to reflect the role of leverage, -50% cash. Annual performance is adjusted by adding 1% to the return of cash, then subtracting this sum from overall returns. Diversification does not assure a profit or protect against loss. It is possible to lose money in a diversified portfolio. The examples are for illustrative purposes only and do not reflect average annualized returns or the performance of any Putnam fund, which will fluctuate. Data are historical. Past performance is not a guarantee of future results. All indexes are unmanaged and measure common sectors of global asset markets. Securities in the indexes do not match those in Putnam funds, and performance will differ. Securities indexes assume reinvestment of distributions and interest payments, and do not take into account brokerage fees and taxes. It is not possible to invest directly in an index.
Asset allocation defined An investment strategy that seeks to balance risk and reward Mixes different assets, such as stocks, bonds, and cash Assets are mixed in amounts that reflect the investor’s time horizon and risk tolerance Greater growth goals or risk tolerance = more equities
Look far for opportunities Source: International Monetary Fund, World Economic Outlook Update, January 2014. Past performance is not indicative of future results.There are no guarantees that prior markets will be duplicated.
Rebalance for consistency Without rebalancing: The market can change your asset allocation 67% 73% Originalbalancedportfolio Portfolio out ofbalance 33% 27% Stocks are represented by the S&P 500 Index and bonds by the Barclays U.S. Aggregate Bond Index. Indexes are unmanaged and represent broad market performance. It is not possible to invest directly in an index. Data is historical. Past performance is not a guarantee of future results. Diversification and rebalancing will not necessarily prevent you from losing money; however, they may reduce volatility and potentially limit downside losses. .
Rebalance for consistency With active rebalancing, asset allocation remains consistent 67% 67% 33% 33% Balancedportfolio Balancedportfolio Stocks are represented by the S&P 500 Index and bonds by the Barclays U.S. Aggregate Bond Index. Indexes are unmanaged and represent broad market performance. It is not possible to invest directly in an index. Data is historical. Past performance is not a guarantee of future results. Diversification and rebalancing will not necessarily prevent you from losing money; however, they may reduce volatility and potentially limit downside losses. .
Consider Putnam Experienced Asset Allocation managers Focused on risk-adjusted returns Global investment flexibility Active strategies EO001 277723 4/13 | 12
Over two decades of experience James A. Fetch20 years Robert J. Kea, CFA 26 years Joshua B. Kutin, CFA16 years Robert J. Schoen24 years Jason R. Vaillancourt, CFA21 years EO001 277723 5/13 | 13
A choice of four funds 70% 30% Target Stocks 67.36% Bonds 40% 60% Target Inflation-sensitive -1.38% 10.04% Credit 20% 80% Target 23.98% Stocks Bonds Putnam Dynamic Risk Allocation as of 12/31/13, Risk balance totals 100%.For illustrative purposes only.
Investing can help you achieve long-term investment goals Diversifying investments with an asset allocation plan helps build wealth and manage risk Work with your financial representative to build a strategy Consider Putnam for asset allocation Develop your plan The views and opinions expressed are those of the speaker, are subject to change with market conditions, and are not meant as investment advice.
A BALANCED APPROACH A WORLD OF INVESTING A COMMITMENT TO EXCELLENCE EO001 277723 5/13 | 17
Investors should carefully consider the investment objectives, risks, charges, and expenses of a fund before investing. For a prospectus or summary prospectus containing this and other information for any Putnam fund or product, call your financial representative or call Putnam at 1-800-225-1581. Please read the prospectus carefully before investing. Putnam Retail Management putnam.com
EO001 277723 5/13 | 19