Download
1 / 6
110 likes | 326 Views
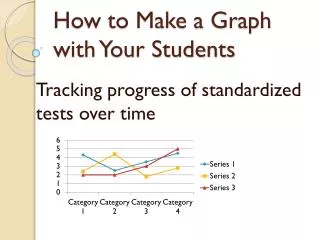
How to make a bar graph. For 2 nd and 3 rd grade students Created by Jennie Lahr. Getting Started. Need to have data to graph Tally up the total to each data topic Pick the kind of graph that will represent the information best For this presentation, we are going to use the bar graph.

E N D
How to make a bar graph For 2nd and 3rd grade students Created by Jennie Lahr
Getting Started • Need to have data to graph • Tally up the total to each data topic • Pick the kind of graph that will represent the information best • For this presentation, we are going to use the bar graph
Coke Sprite Root beer Mountain Dew Grape Orange Pepsi Strawberry Dr. Pepper Other Data: Favorite Pop
Coke = 4 Sprite = 5 Root Beer = 6 Mountain Dew = 8 Grape = 2 Orange = 3 Pepsi = 6 Strawberry = 1 Dr. Pepper = 4 Other = 2 Tally up the kinds of favorite pop