Download
1 / 60
610 likes | 789 Views
A High-Fidelity Temperature Distribution Forecasting System for Data Centers. Guoliang Xing Assistant Professor Department of Computer Science and Engineering Michigan State University. Cyber-Physical Systems.

E N D
A High-Fidelity Temperature Distribution Forecasting System for Data Centers Guoliang Xing Assistant Professor Department of Computer Science and Engineering Michigan State University
Cyber-Physical Systems • “Cyber-physical systems are engineered systems that are built from and depend upon the synergy of computational and physical components”1 • Many critical application domains • Medical, auto, energy, transportation… • # 1 national priority for Networking and IT Research and Development (NITRD) • NITRD Review report by President's Council of Advisors on Science and Technology (PCAST) titled “Leadership Under Challenge: Information Technology R&D in a Competitive World”, 2007 1 NSF Cyber-physical systems solicitation13502
Our CPS Projects • Data center thermal monitoring • Real-time volcano monitoring • Aquatic process profiling Tungurahua Volcano, Ecuador Harmful Algae Bloom in Lake Mendota in Wisconsin, 1999 Data Center Monitoring, HPCC, MSU Volcano Monitoring Sensors Robotic fish, Smart Microsystems Lab, MSU
Outline • Data center thermal monitoring • Background • System design • Testbed evaluation • Real-time volcano monitoring • Barcode streaming for smartphones
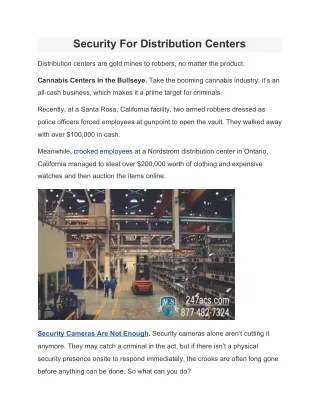
Motivation • Data centers are critical computing infrastructure • 509,147 data centers world wide, 285 million sq. ft.1 • 2.8M hours of downtime, 142 billions direct loss/year1 • 23% server outages are heat-induced shutdowns An aerial view of EMC's new data center in Durham, North Carolina2 An EMC data center 2 1Emerson Network Power, State of the Data Centers 2011, 2http://www.datacenterknowledge.com/archives/2011/09/15/emc-opens-new-cloud-data-center-in-nc/.
Motivation • Many data centers are overcooled • Low AC set-points, high server fan speeds • Excessive cooling energy • up to 50% or more of total power consumption • Rapid increase of energy use in data centers • From 2005 to 2010, electricity use in data centers grew 36% (US) and 56% (world wide)1 • An estimated 2% of electricity budget of US1 1Jonathan G. Koomey, “Grouth in data center electricity use 2005 to 2010”, Analytics Press, 2011.
Temperature Forecasting • Predict server temperature evolution • Identify potential hot spots • Enable high CRAC set-points for energy saving • Temperature at inlets/outlets indicates hotspots cool air hot air Inlets Outlets
Requirements • High-fidelity Prediction • 1 oC prediction error • Long prediction horizons (e.g., 10 minutes) • Coverage: normal conditions & emergencies (e.g., AC failures) • Timeliness and low overhead • Real-time online prediction • Decouple from infrastructure in data center
Challenges • Complex air and thermal dynamics • Highly dynamic workloads • Physical failures • ACs, servers, fans Row 2 Server exhaust Raised-floor cold air Row 1 12-day CPU utilization data of one rack (64 servers with 512 CPU cores) in High Performance Computer Center at Michigan State University
Related Work • Data-driven prediction approach • Collect in situ sensor data • Construct prediction model (parameter learning) • Regression, neural networks, etc. • Real-time prediction • Limitation • Require extensive training • Rare but critical physical failures in data centers?
Related Work • Computational Fluid Dynamics (CFD) modeling • Spatially discretized geometry model • Iteratively solve partial differential equations • Limitation • Inaccuracy, high compute complexity error
System Architecture • CFD + Wireless Sensing + Data-driven Prediction • Preserve realistic physical characteristics in training data • Capture dynamics by in situ sensing and real-time prediction Data Center Sensing (CPU, fan speed, temperature, airflow) geometric model (server/rack dimension and placement) CFD Modeling Real-time Prediction Calibration
Thermal Sensing Sensing Temperature Air velocity CRAC Temp Airflow velocity CPU utilization Fan speed LAN Inlet / Outlet Temperature
CFD Modeling & Calibration Data Center Sensing (CPU, fan speed, temperature, airflow) CFD Modeling Real-time Prediction Calibration
CFD Modeling & Calibration CFD Modeling Physical Geometry Model t t+6 min t+3 min Steady/Transient CFD Steady Transient Polynomial Calibration Calibration order Sensor Data Training: sensor reading Runtime: calibrated temperature Calibration coefficients Temperature from CFD
Real-time Prediction Data Center Sensing (CPU, fan speed, temperature, airflow) CFD Modeling Real-time Prediction Calibration
Real-time Prediction • Thermal variable vector • t : server inlet/outlet temperature • c : CRAC supply air temperature • v : CRAC airflow • u : CPU utilization • s : Server fan speed • R : The amount of historical data • Prediction with k –step horizon • : Linear regression parameter matrix • Least-squared based training Real-time Prediction Training Linear Prediction Model Prediction
Single-rack Experiment Ceiling vent airflow sensor Insulation • Testbed configuration • 30 temperature sensors • Telosb, Iris • 2 airflow sensors • AccuSense F333 • 15 servers • Dell PowerEdge 850 • Western Scientific • Controlled CPU utilization Temperature sensor Temperature sensor Airflow sensor AC inlet
Experiment Results • Multi-horizon prediction • CFD-assisted prediction Error increases with horizon
Production Data Center Experiment Chained Temp. sensor • Testbed configuration • 5 racks, 229 servers, 2016 cores • 4 in-row CRAC units • 35 temperature sensors • 4 airflow sensors • Dynamic CPU utilization In-row CRACs In-row CRACs Airflow sensor Temperature sensor
Experiment Results • Long-term experiment (12 days) Outlet Inlet
Outline • Data center thermal monitoring • Real-time volcano monitoring • Background • Quality-driven earthquake detection • Deployment and evaluation • Barcode streaming for smartphones
Volcano Hazards • 7% world population live near active volcanoes • 20 - 30 explosive eruptions/year Eruptions in Iceland 2010 A week-long airspace closure [Wikipedia] Eruption in Chile, 6/4, 2011 $68 M instant damage, $2.4 B future relief. www.boston.com/bigpicture/2011/06/volcano_erupts_in_chile.html
Volcano Monitoring • Traditional seismometer • Expensive (~ $10K), bulky, difficult to install, up to a dozen of nodes for most active volcanoes! • Data collection and retrieval • ~10G data in a month • Processing • Detection, timing, localization • 4D Tomography computation • Real-time, 3D fluid dynamics of a volcano conduit system • Extremely computation-intensive
VolcanoSRI Project • Large-scale, long-term deployment • Up to 500 nodes on an active volcano in Ecuador • Sampling@100Hz, several month lifetime • Collaborative in-network processing • Detection, timing, localization • 4D tomography computation • The tentative deployment map at Ecuador • (Photo credits: Prof. Jonathan Lees)
Challenge 1: Spatial Diversity • Complicated physical process • Highly dynamic magnitude • Dynamic source location Two earthquakes on Mt St Helens
Challenge 2: Frequency Diversity • Responsive to P-wave within [1 Hz, 10 Hz] • Freq. spectrum changes with signal magnitude [5 Hz, 10 Hz] [1 Hz, 5 Hz] X 100 Signal energy: X 10000
Approach Overview system decision FFT • Select sensors with best signal qualities • FFT (computation-intensive) • Local detection • Decision fusion ‘1’ seismic sensor sensor selection ‘0’ decision fusion ‘1’ FFT FFT avoid raw data transmission
Smartphone-based Node IOIO board Amplifier Seismometer Geospace Geophone model GS-11D External GPS LG GT540 Android 1.6 GPS antenna
Field Deployment • First deployment on Tungurahua, Ecuador • Six nodes, one week, 8/2012
Results • Centralized processing • Data collection w/ compression • STA/LTA • Heuristic seismic detection algorithm • Weighted decision fusion • No sensor selection 19 days 5% detect prob. Signal collected by our node 3.9 months Signal collected by permanent seismometer
Outline • Data center thermal monitoring • Real-time volcano monitoring • Barcode streaming for smartphones • Background • Barcode streaming • Implementation and evaluation
Barcode-based Communication • Wireless payment • Preserve security and privacy PayPal inStore App • Advertisement • Broadcastbrochures, coupons and maps (e.g., retail stores, museums) • Data exchange • Transfer small piece of info btw smartphones (e.g., contacts, photos)
Existing 2D Barcodes HCCB [2] (High Capacity Color Barcode) QR code [1] Low capacity (typically 50 chars) High decoding overhead Not suitable for high-rate streaming [1] I. 18004:2006. Automatic identification and data capture techniques - QR code 2005 bar code symbologyspecification. [2] D. Parikh and G. Jancke. Localization and segmentation of a 2d high capacity color barcode. In Applications of Computer Vision, 2008.
COBRA Barcode Design • High capacity & fast decoding rate • Smart frame • Corner Tracker • Timing Reference Blocks • Code area • Blocks with 4 orthogonal colors • Single barcode capacity up to 20 Kbits (4 inch) p
Challenges • Poor image quality • Low quality camera • Small size and low resolution screen • Relative movement Severe blurin captured images Distorted barcode image Original barcode Typical received barcode image • Perspective distortion • Limited computation resource • Need to capture and process up to 30 images per second
Blur-aware Color Ordering Blur usually occurs along the borderof blocks with different colors Typical barcode image captured by smartphone camera
Blur-aware Color Ordering Goal: Group blocks with same color to reduce border length. Color ordering
Implementation & Evaluation • Implementation • Android 2.3.3 Gingerbread • Sender: 56 KB storage, 5MB RAM, Nexus S (4 inch screen, 800x480) • Receiver: 72 KB storage, 3.5~12MB RAM, HTC Inspire (8MP camera) • 200Kbps throughput under various settings • - Block size • - View angle, alignment • Screen refreshing rate, camera resolution • Mobility, distance • Ambient lighting, screen brightness HTC Inspire Nexus S
Future Work • Data center monitoring • Workload scheduling, power optimization • Volcano monitoring • Signal processing: timing and localization • System building: power management and programming interfaces • Barcode streaming for smartphones • Security of light channel and user authentication
Acknowledgement • Group members • TianHao (Ph.D, 2010-), Yu Wang (Ph.D, 2010-), Jun Huang (Ph.D, 2009-), Ruogu Zhou (Ph.D, 2009-), Dennis Philips (Ph.D, 2009-), Jinzhu Chen (Ph.D, 2010-), Mohammad-MahdiMoazzami (Ph.D, 2011-), Fatme El-Moukaddem (Ph.D, co-supervised with Dr. Eric Torng), Rui Tan (Postdoc) • National Science Foundation • CDI, VolcanoSRI, 2011-2015 (in collaboration with WenZhan Song @ Georgia State University, Jonathan Lees@University of North Carolina, Chapel Hill) • CAREER, performance-critical sensor networks, PI, 2010-2015. • ECCS, aquatic sensor networks, PI, 2010-2013 (in collaboration with Xiaobo Tan @ MSU) • CNS, real-time and performance control of networked sensor system, MSU PI, 2012-2015 (in collaboration with Xiaorui Wang @ Ohio State) • CNS, Interference in crowded spectrum, MSU PI, 2009-2012 (in collaboration with Gang Zhou @ William & Mary)
Representative Publications • J. Chen, R. Tan, Y. Wang, G. Xing, X. Wang, X. Wang, B. Punch, D. Colbry, A High-Fidelity Temperature Distribution Forecasting System for Data Centers, The 33st IEEE Real-Time Systems Symposium (RTSS), 2012, acceptance ratio: 35/157=22% • R. Tan, G. Xing, J. Chen, W. Song, R. Huang, Quality-driven Volcanic Earthquake Detection using Wireless Sensor Networks, 31st IEEE Real-Time Systems Symposium (RTSS), 2010. • T. Hao, R. Zhou, G. Xing, COBRA: Color Barcode Streaming for Smartphone Systems, The 10th International Conference on Mobile Systems, Applications, and Services (MobiSys), 2011, acceptance ratio: 32 / 182 = 17.5% • J. Huang, G. Xing, G. Zhou, R. Zhou, Beyond Co-existence: Exploiting WiFi White Space for ZigBee Performance Assurance, The 18th IEEE International Conference on Network Protocols (ICNP), 2010, acceptance ratio: 31/170 = 18.2%, Best Paper Award (1 out of 170 submissions). • R. Zhou, Y. Xiong, G. Xing, L. Sun, J. Ma, ZiFi: Wireless LAN Discovery via ZigBee Interference Signatures, The 16th Annual International Conference on Mobile Computing and Networking (MobiCom), acceptance ratio: 33/233=14.2%. • S. Liu, G. Xing, H. Zhang, J. Wang, J. Huang, M. Sha, L. Huang, Passive Interference Measurement in Wireless Sensor Networks, The 18th IEEE International Conference on Network Protocols (ICNP), acceptance ratio: 31/170 = 18.2%, Best Paper Candidate (6 out of 170 submissions). • X. Xu, L. Gu, J. Wang, G. Xing, Negotiate Power and Performance in the Reality of RFID Systems, The 8th Annual IEEE International Conference on Pervasive Computing and Communications (PerCom), acceptance ratio: 27/227=12%, Best Paper Candidate (3 out of 227 submissions) .
COBRA • Real-time visible light communication (VLC) system for off-the-shelfsmartphones • Encode info into color barcodes • Stream barcodes from screen to camera • High communication throughput (70~200 kbps for 4 inch, 800x640 screen) or Streaming barcodes btw screen and camera sender receiver
Quality-driven Earthquake Detection • Assured false alarm rate & detection probability • Real-time detection • Temporal resolution: 1s • Long network lifetime • Avoid raw data transmission
System Overview CODE GENERATION PRE-PROCESSING CODE EXTRACTION Motion-aware coding Color enhancement Code Scan Blur-aware color ordering Smart Frame detection Blur assessment Sender Receiver Encode data into barcodes and display on the screen
System Overview CODE GENERATION PRE-PROCESSING CODE EXTRACTION Motion-aware coding Color enhancement Code Scan Smart Frame detection Blur assessment Blur-aware color ordering Sender Receiver Select and enhance the received images
System Overview CODE GENERATION PRE-PROCESSING CODE EXTRACTION Motion-aware coding Color enhancement Code Scan Smart Frame detection Blur assessment Blur-aware color ordering Sender Receiver Extract data from enhanced images
Decision Fusion at BS • Extended majority rule • Closed-form detection performance # of positive local decisions > threshold, decide 1 total # of sensors PF = f ( PF1, PF2, …, PFN ) PD = f ( PD1, PD2, …, PDN ) PFi / PDi : false alarm rate / detection prob. of sensor i
Block Size Measured on 800x480 resolution screen Small block size can achieve higher throughput (>200 kbps) at the cost of lower decoding rate (<80%). Big block size can achieve higher decoding rate (>99.5%) at the cost of lower throughput (<150kbps)
Putting It All Together Historical Sensor Data Prediction Prediction Models Training CFD Transient Modeling Real-time Data Collection 18/24