Download
1 / 1
10 likes | 149 Views
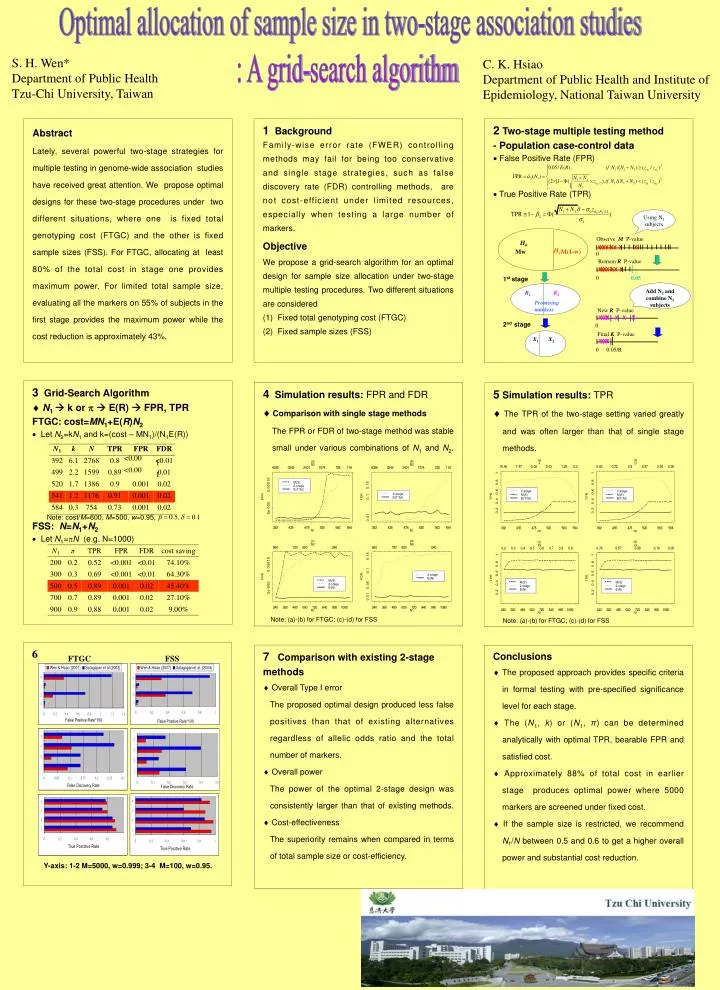
2 Two-stage multiple testing method - Population case-control data False Positive Rate (FPR) True Positive Rate (TPR). Using N 1 subjects. H 0 H 1. Observe M P-value. X. X. X. X. X. X. X. X. 0. Remain R P-value. X. X. X. X. X. X. X. 0. 0.05. 1 st stage.

E N D
2 Two-stage multiple testing method - Population case-control data False Positive Rate (FPR) True Positive Rate (TPR) Using N1 subjects H0H1 Observe M P-value X X X X X X X X 0 Remain R P-value X X X X X X X 0 0.05 1st stage Add N2 and combine N1 subjects R1R2 Promising markers New R P-value X X X X X X X X 2nd stage 0 Final K P-value X1X2 X X X X X 0.05/R 0 4 Simulation results: FPR and FDR Comparison with single stage methods The FPR or FDR of two-stage method was stable small under various combinations of N1 and N2. 5 Simulation results: TPR The TPR of the two-stage setting varied greatly and was often larger than that of single stage methods. FTGC FSS Note: (a)-(b) for FTGC; (c)-(d) for FSS Note: (a)-(b) for FTGC; (c)-(d) for FSS Optimal allocation of sample size in two-stage association studies : A grid-search algorithm S. H. Wen*Department of Public Health Tzu-Chi University, Taiwan C. K. Hsiao Department of Public Health and Institute of Epidemiology, National Taiwan University 1 Background Family-wise error rate (FWER) controlling methods may fail for being too conservative and single stage strategies, such as false discovery rate (FDR) controlling methods, are not cost-efficient under limited resources, especially when testing a large number of markers. Objective We propose a grid-search algorithm for an optimal design for sample size allocation under two-stage multiple testing procedures. Two different situations are considered (1) Fixed total genotyping cost (FTGC) (2) Fixed sample sizes (FSS) Mw M(1-w) Abstract Lately, several powerful two-stage strategies for multiple testing in genome-wide association studies have received great attention. We propose optimal designs for these two-stage procedures under two different situations, where one is fixed total genotyping cost (FTGC) and the other is fixed sample sizes (FSS). For FTGC, allocating at least 80% of the total cost in stage one provides maximum power. For limited total sample size, evaluating all the markers on 55% of subjects in the first stage provides the maximum power while the cost reduction is approximately 43%. 3 Grid-Search Algorithm N1 k or E(R) FPR, TPR FTGC: cost=MN1+E(R)N2 Let N2=kN1 and k=(cost – MN1)/(N1E(R)) FSS: N=N1+N2 Let N1=N (e.g. N=1000) Note: cost/M=600, M=500, w=0.95, 6 7 Comparison with existing 2-stage methods Overall Type I error The proposed optimal design produced less false positives than that of existing alternatives regardless of allelic odds ratio and the total number of markers. Overall power The power of the optimal 2-stage design was consistently larger than that ofexisting methods. Cost-effectiveness The superiority remains when compared in terms of total sample size or cost-efficiency. Conclusions The proposed approach provides specific criteria in formal testing with pre-specified significance level for each stage. The (N1, k) or (N1, π) can be determined analytically with optimal TPR, bearable FPR and satisfied cost. Approximately 88% of total cost in earlier stage produces optimal power where 5000 markers are screened under fixed cost. If the sample size is restricted, we recommend N1/N between 0.5 and 0.6 to get a higher overall power and substantial cost reduction. Y-axis: 1-2 M=5000, w=0.999; 3-4 M=100, w=0.95.