Download
1 / 16
160 likes | 196 Views
Spectrograph Status. Etc. Why the Spectrograph?. Our main chamber is designed to measure absolute total and line fluorescence intensities. The spectrograph will support this measurement by further resolving line shapes and relative intensities.

E N D
Spectrograph Status Etc.
Why the Spectrograph? • Our main chamber is designed to measure absolute total and line fluorescence intensities. • The spectrograph will support this measurement by further resolving line shapes and relative intensities. • Recall that Nagano used narrow bands only and therefore could not resolve spectral features. • Repeat of Clive’s decay time for individual lines as was done for T-461.
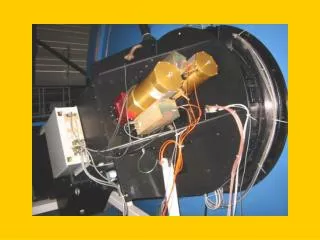
System Layout • Gas Chamber • Optics • Spectrograph • PMT • Cables • DAQ
Gas Chamber Optics Spectrograph PMT Cables DAQ Beam Window Light Pipe 45o mirror Light Pipe Fused Silica Window End of Pressure System All parts in shops. System Layout
Gas Chamber Optics Spectrograph PMT Cables DAQ Flat Mirror Spherical Mirror Actuator Enclosure Mounts System Layout
Gas Chamber Optics Spectrograph PMT Cables DAQ Spectrograph Gratings Slit 0.3 mm 0.4 mm 0.5 mm System Layout
Gas Chamber Optics Spectrograph PMT Cables DAQ PMT PMT Base DAQ cables connection Mount to spectrograph Due Mid August System Layout
Gas Chamber Optics Spectrograph PMT Cables DAQ 32 channels plus HV Purchased Pulled Connectors System Layout
Gas Chamber Optics Spectrograph PMT Cables DAQ (2) Computer ISA CAMAC card CAMAC crate with adc cards DOS based pascal or c daq program. Clive has built similar systems. Put it all together System Layout
Spectrograph Summary • Reminder: This is a secondary measurement and was an after thought to our experiment. • If delivery schedules hold up we should be able to get system ready.
DAQ 1 • The main DAQ computer remains a LabView based system that will look quite similar to the system used in T-461. • In addition, the system will crunch the numbers after each run is complete and display the results.
Online Processing: DAQ 1 • Ascii text files are generated during a given data part. • When the run is stopped a “flag” will be set saying it’s okay to process the data. • Ascii files are then converted to ROOT ntuples. • Different files (.dat and .sam) are merged.
Online Processing: DAQ 1 • There will be a simple GUI that allows you to look at recent runs. • Would like to interface to Matt Dalton (et al.) GUI. He displays what we expect to see and then I tell him what we actually saw. • If new data starts coming in, processing will stop (asap). (A green light will appear when processing done. Perhaps even a % done indicator.) • May cause slight slow down (IE wait until processing done before starting new part < 3 minutes total). Worth it???
Gas System • T-461 setup is essentially the current setup. • Ability to use “SLAC” air is expected. This will allow “humid” air tests. • Clive has suggested a humidity monitor be added to chamber… • July 5 write-up copies available.