Download
1 / 18
180 likes | 190 Views
Conduct your own Plastic Pollution Brand Survey to uncover the top culprits and use real-life statistics to persuade brands to make a change. Arm yourself with data and lead the charge against plastic pollution.

E N D
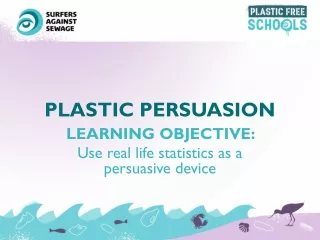
PLASTIC PERSUASION LEARNING OBJECTIVE: Use real life statistics as a persuasive device
THE DIRTY DOZEN Almost a decade ago, Surfers Against Sewage conducted a Plastic Pollution Brand Survey;a brand audit that revealed that the majority of all beach litter (56%) was attributable to just twelve corporations, dubbed the ‘Dirty Dozen’. Talk in pairs, remember to prepare reasons for your answers. What might Surfers Against Sewage’s motive be for doing this survey? Can you suggest who the top culprits may be? How useful is this data now?
The Dirty Dozen Data Corporation In your pairs, choose three of the following questions to discuss. If the litter pick had been repeated the following week would the data be the same or different? Why? Is the data reliable? Why? What story does the data tell us? How can this data be updated? How many items of litter were collected in total? What is the range of this data set?
QUESTION:If the survery was repeated today would the Dirty Dozen remain the same?WHY?
YOUR MISSION: Surfers Against Sewage are inviting you to conduct your very own Plastic Pollution Brand Survey ‘Wherever you are, and whether it’s a mountain or a river, in the city or by the sea, you can play a part. Let’s make the polluter pay!’ Find the new ‘Dirty Dozen!’ Arm yourself with statistics! Lead the change with some plastic persuasion!
Plan the pick! As a class, plan how you will collect your data. Where/when will you conduct your survey? For what duration? How will you record your findings? Will you do it more than once to observe differences? Why are you gathering this data? What purpose will it serve?
Data Collection: Tally Chart A tally chart to show the frequency of plastic litter found for each brand
Data Collection: Tally Chart A tally chart to show the TOTAL frequency of plastic litter found for each brand
Data Collection: Pie Chart • To draw a pie chart for the Dirty Dozen data • Find total frequency = 330 • Find proportion of total items for each • brand • Nestle • 51 ÷ 330 x 360˚= 55.6˚ • Coca Cola • 49 ÷ 330 x 360˚ = 53.4˚ Choose a brand, tell your partner how you would calculate the proportion of the pie chart to allocate it.
Data Collection: Pie Chart A pie chart to show the frequency of plastic litter found for each brand: The Dirty Dozen Use one of the following phrases to make a statement about the data depicted. proportion approximately most common least common
Using the data collected in your brand survey, draw a pie chart. Our success criteria
QUESTION:Did the Dirty Dozen remain the same?Are there any similarities?What are the key differences?What is the biggest surprise?
YOUR MISSION: Surfers Against Sewage are inviting you to conduct your very own Plastic Pollution Brand Survey ‘Wherever you are, and whether it’s a mountain or a river, in the city or by the sea, you can play a part. Let’s make the polluter pay!’ Find the new ‘Dirty Dozen!’ Arm yourself with statistics! Lead the change with some plastic persuasion!
CHALLENGE:Numbers are power. Use them to PERSUADE a brand to make a change.