Download
1 / 28
280 likes | 363 Views
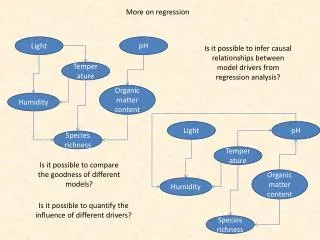
Explore if sitting closer in class impacts student achievement using regression analysis and statistical inference on a seating experiment. Discover correlations and interpret the results of a classroom study on seat locations and test grades. Learn how to check conditions for regression analysis and interpret regression line equations and confidence intervals.

E N D
Ch 12 - More about Regression • “The Last Chapter!”
Does seat location matter? Many people believe that students learn better if they sit close to the front of the classroom. Does sitting closer cause higher achievement, or do better students imply chose to sit in the front? Students were randomly assigned to seat locations in a teacher’s classroom for a chapter and their location was recorded as well as their chapter test grade. The explanatory variable in this experiment is which row the student was assigned (Row 1 is the closest to the front and Row 7 is the farthest away). Here are the results:Row 1: 76, 77, 94, 99Row 2: 83, 85, 74, 79Row 3: 90, 88, 68, 78Row 4: 94, 72, 101, 70, 79Row 5: 76, 65, 90, 67, 96Row 6: 88, 79, 90, 83Row 7: 79, 76, 77, 63
Construct a scatter plot and describe what you see. • Interpret the slope of the least-squares regression line in this context. • Explain why it is important to randomly assign the students to seats rather than students selecting their own seats. • Does the negative slope provide convincing evidence that sitting closer to the board causes higher achievement, or is it plausible that the association is due to the chance variation in the random assignment?
What will we make an inference about? • Slope or y-intercept? • Greek symbols for parameters, and “regular” letters for statistics!
Conditions to Check • L - Linear - the actual relationship between x and y is linear • I - Independent - individual observations are independent of one another • N - Normal - for any fixed value of x, the y-value varies according to a Normal distribution • E - Equal Variance - the standard deviation of y is the same for all values of x • R - Random - the data comes from a well-designed random sample or randomized experiment
How are we going to check that stuff? • Linear - check overall pattern of scatterplot, check the residual plot (transformations might be needed) • Independent - look at design to ensure random sampling, if sampling without replacement, check the 10% condition • Normal - create a graph of the residuals to check for any strong skewness or major outliers. Graphs - histogram, Normal Probability plot, or stemplot • Equal Variance - The scatter about zero for the residuals should be evenly above and below for all x-values • Random - same as always!
Check the conditions for our “where you sit” example • L • I • N • E • R
A little review on computer output • Here is the computer output for the least-squares regression line for the seating-chart data: X X X X
State the equation of the least-squares regression line. State any variables you use. • Interpret the slope, y-intercept (if possible) and standard deviation of the residuals.
t Interval for the Slope of a LSRL • Formula: b + t*SEb • Where t* = critical value with n - 2 degrees of freedom • SEb =
Back to our Seats & Grades • Identify the standard error of the slope SEb from the computer output provided. Interpret this in context of the problem. • Calculate the 95% confidence interval for the true slope. Show your work. • Interpret the interval from part (b). • Based on your interval, is there convincing evidence that seat location affects scores?
(a) SEb = 0.9472. If we repeated the random assignment many times, the slope of the estimated regression line would typically vary by about 0.9472 from the slope of the true regression line for predicting test scores from row number.
(b) df = 30 - 2 = 28, so t* = 2.048 (you can use table B or your invT command) • -1.1171 + 2.048(0.9472) = (-3.0570, 0.8228)
(c) I am 95% confident that the interval from -3.0570 to 0.8228 captures the true slope for the regression line relating a test score (y) and the students row number (x).
(d) Since a 95% confidence interval contains 0 as a plausible slope, I do not have convincing evidence that there is an association between test score and row number.
Two students decided to investigate the effect of sugar on the life of cut flowers. They went to the local grocery store and randomly selected 12 carnations. All the carnations seemed equally healthy when they were selected. When the students got home, they prepared 12 identical vases with exactly the same amount of water in each vase. They put one tablespoon of sugar in 3 vases, two tablespoons of sugar in 3 vases, and three tablespoons of sugar in 3 vases. In the remaining 3 vases, they put no sugar. After the vases were prepared and placed in the same location, the students randomly assigned one flower to each vase and observed how many hours each flower continued to look fresh. Here are the data:
Below are the least squares regression analysis for these data from Minitab.
a) Construct and interpret a 99% confidence interval for the slope of the true regression line. • b) Would you feel confident predicting the hours of freshness if 10 tablespoons of sugar are used? Explain.
t Test for the Slope of the Population Regression Line • test statistic = statistic - parameter • standard deviation of statistic • t = b - B0 with df = n - 2 • SEb
Why preform a significance test on the slope? • Really no association and we got a nonzero slope due to random chance variation due to random assignment • Really is an association
Do customers who stay longer at buffets give larger tips? While Charlotte was working at the local Asian buffet, she collected a random sample of receipts, which included the length of time (in minutes) the party was in the restaurant and the amount of the tip (in dollars). Do these data provide convincing evidence that customers who stay longer give larger tips? Here are the data:
a) Construct a scatterplot with the least squares regression line on your calculator. Describe what this graph tells you about the relationship between the two variables.
b)What is the equation of the least squares regression line? Define any variables you use. • c) Interpret the slope and y-intercept of the least squares regression line in context.
d) Using the computer output and graphs below, carry out an appropriate test to answer Charlotte’s question.
Confidence intervals give a better picture • A random sample of 11 used Honda CR-V’s from the 2002-6 model years was selected from the inventory at www.carmax.com. The number of miles driven and the advertised price were recorded for each CR-V. A 95% confidence interval for the slope of the LSRL for predicting advertised price from number of miles (in thousands) driven is (-50.1, -122.3) • Based on the interval, what conclusion would you draw from a test of H0: B = 0 versus Ha: B does not = 0 at the 0.05 significance level? • What more information do you gain from the confidence interval?
Calculators! • Confidence Intervals: LinRegTInt • Significance Tests: LinRegTTest