Download

1 / 86
890 likes | 1.4k Views
Lecture 12. Instrumental methods of analysis. Photometry. Associate prof . L.V. Vronska Associate prof . M.M. Mykhalkiv. Outline. Classification, advantages and lacks of physical-chemical methods of the analysis. Optical methods of the analysis. Classification.

E N D
Lecture 12 Instrumental methods of analysis. Photometry. Associate prof . L.V. Vronska Associate prof . M.M. Mykhalkiv
Outline • Classification, advantages and lacks of physical-chemical methods of the analysis. • Optical methods of the analysis. Classification. • The fundamental law of absorption. • Electronic spectrum. • Photometric method of analysis: an essence, theoretical bases, usage in the pharmaceutical analysis. • Multiwave spectrophotometry. • Differential spectrophotometry. • The extraction-photometric analysis. • Photometric titration.
1. Classification, advantages and lacks of physical-chemical methods (PCMA) of the analysis. • Physical and physical-chemical methods of the analysis are based on dependence application between measured physical properties of substances and qualitative (quantitative) composition
PCMAare dividedon: • Opticalmethods are based on measurement of optical properties of substances. • Chromatographic methods are based on usage of ability of different substances to selective sorption. • Electrochemical methods are based on measurement of electrochemical properties of substances. • Radiometric methods are based on measurement of radioactive properties of substances. • Thermalmethods are based on measurement of heat effectsof substances. • Mass spectrometric methods are based on studying of the ionized fragments ("splinters") of substances. • Kineticmethods are based on measurement of dependence of speed of reaction from concentration of substance
Advantage of PCMA • High sensitivity - a low limit of detection (10-9g) and definition • High selectivity • Rapid analysis methods • Automation and computerization is possibility • Analysis is possibility on distance • Possibility of the analysis without destruction of the sample • Possibility of the local analysis
Lacks of PCMA • Definition error is near ± 5 % (on occasion to 20 %), whereas - 0,01-0,005 % for gravimetry and 0,1-0,05 % for titrimetry • Reproducibility of results in separate methods is worse, than in classical methods of the analysis • It is necessary of usage of standards and standard solutions, graduation of equipment and plotting of calibration charts • Complexity of used equipment, its high cost, high cost of standard substances
2. Optical methods of the analysis. Classification. А) On investigated objects • The nuclear spectral analysis • The molecular spectral analysis
B) On the nature of interaction of electromagnetic radiation with substance 1.Absorption analysis • Atomic-absorption analysis • Molecular-absorption analysis • Turbidimetric analysis 2. The emissive spectral analysis • flame photometry • fluorescence analysis • The spectral analysis with usage of effect of combinational dispersion of light
3. Other methods • nephelometric method • refractometric analysis • polarimetric analysis • interferometric analysis
C) On electromagnetic spectral range which use in analysis: • Spectroscopy (spectrophotometry) in UV and visible spectrum • IR - Spectroscopy • X-ray spectroscopy • Microwave spectroscopy
D) By the nature of energy jump • Electronic spectrum • Vibrational spectrum • Rotational spectrum
3. The fundamental law of absorption. Reflection of light sample Dispersion of light radiation source Light absorption luminescence
First law of light absorption • Each thin layer of constant thickness of a homogeneous environment absorbs an identical part of incident radiation or: • The part of the light which is absorbed by a homogeneous environment, is directly proportional to a thickness of an absorbing layer:
Second law of light absorption • The part of the absorbed radiation is proportional to number of absorbing particles in volume of a solution, that is concentration
Bouguer-Lambert-Beer law • Reduction of intensity of light which has passed through a layer of light-absorbing substance is proportional concentration of this substance and a thickness of a layer
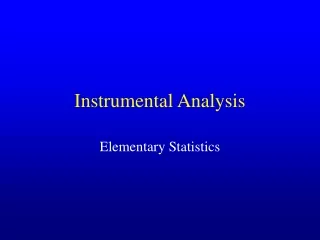
Quantitative characteristics of absorption 1. Transmittance - the ratio of the radiant power passing through a sample to that from the radiation’s source (T). (I0) (I) or
Diagram of Beer–Lambert absorption of a beam of light as it travels through a cuvette of width ℓ.
Optical density А (Absorbance) An alternative method for expressing the attenuation of electromagnetic radiation is absorbance, A, which is defined as or
Bouguer-Lambert-Beer law So: • The absorbanceof a solution is proportional to concentration of light-absorbing substance and a thickness of a layer Or • The relationship between a sample’s absorbance and the concentration of the absorbing species where: A – optical density (absorbance), ε – the molar absorptivity, C – concentration (molarity)
Additivity of optical densities • Beer’s law can be extended to samples containing several absorbing components provided that there are no interactions between the components. Individual absorbances, Ai, are additive. For a two-component mixture of X and Y, the total absorbance, Atot, is So A = l(1С1 + 2С2 + …kСk)
Physical Limitations to Beer’s Law • NOT monochromaticity of light: A = lС. • NOT parallelism of light. • Temperature. • NOT identical value of refraction of solutions. • NOT proportionality of a photocurrent and intensity of a light
Chemical Limitations to Beer’s Law • Dilution of solution (than more of reagent excess, it is less deviation from the law); • рН of medium: state of metal ion stability of complex ions • competitivereactions (for ligand) • competitivereactions (complexing agent) • polymerization and dissociationreactions • ox-red reactions
4. Electronic spectrum • absorbance spectrum - a graph of a sample’s absorbance of electromagnetic radiation versus wavelength (or frequency or wavenumber).
emission spectrum is a graph of emission intensity versus wavelength (or frequency or wavenumber).
5. Photometric method of analysis: an essence, theoretical bases, usage in the pharmaceutical analysis • Molecular–absorption method is based on measurement of absorption by molecules (or ions) substances of electromagnetic radiation of an optical range: • Colorimetry in which visible light was absorbed by a sample. The concentration of analyte was determined visually by comparing the sample’s color to that of a set of standards using Nessler tubes (as described at the beginning of this chapter), or by using an instrument called a colorimeter. • Photocolorimetry - in which polychromatic light was absorbed by a sample • Spectrophotometry - in which monochromatic light was absorbed by a sample • UV - Spectrum (100-200 to 380-400 nanometers) • Visible spectrum (380-400 to 780-800 nanometers)
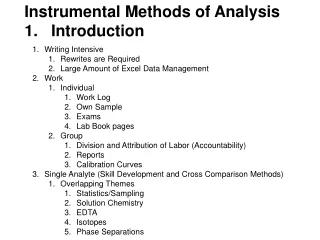
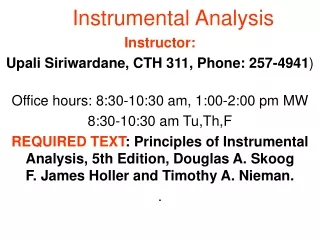
Block diagram for a double-beam in-timescanning spectrophotometer with photo of atypical instrument.
Choice of optimum conditions of spectrophotometry: • Choice absorption filters (in photometry) • Choice of absorbance Аoptimal= 0.435 (less error) А = 0.6 – 0.7 • !!!! Not probably to measure absorbance 2 < А < 0.03 • Choice of thickness of a layer- not more 5 сm А = l C • Way of transformation of a defined component in photometric compound
Sensitivity of photometric definition А = l C Cmin= Аmin / l • А = 0.01 • l = 1 cм • = 1000 thenСmin = 10-5mol/L
Accuracy of photometric definitiondepends from: • Specific features of photometric reaction or photometric compounds • Characteristics of the used device (usually makes 1 - 2 % relative)
Methods of quantitative analysis: 1. A method of calibrationchart !!!The method can be applied, if: • Structure of standard and investigated solutions are similar • The interval of concentration on calibration chart should cover of defined concentration
2. Comparison method (a method on one standard) !! The method can be used if: • Dependence structure - property is strictly rectilinear and passes through the beginning of co-ordinates • Concentration of standard and investigated solutions values of analytical signals as much as possible similar and minimum different • Structure of standard and investigated solutions are as much as possible similar
3. Method of molar or specific (concentration on % w/w) absorptivity !! The method can be used if: • Strict linearity of dependence structure - an analytical signal is observed • The analytical device maintains requirements of metrological checking
4. Method of additives !!! The method can be applied, if: • It is necessary to consider stirring influence of extraneous components of sample on analytical signal of defined substance
Usage of UV – spectroscopy and spectrophotometry in visible spectrum: • Identification and establishment of identity of drugs • Quantitative definition of substance contain • Cleanliness check • The express control of the forged drugs • Research of new substances structure
6. Multiwave spectrophotometry • The absorbance of any system containing limited number of painted components which chemically one don’t react with another, is equal sum of absorbance of mix components at the same wavelength:
1. Analysis of two componential mix, when light absorption curves both substance bridge along all spectrum, but on it is partite maximums of absorption