Download
1 / 12
280 likes | 992 Views
Data Handling. Objectives. To consider the data handling cycle and the effective teaching of data handling To clarify the terminology and conventions used for different tables, charts, graphs and diagrams. Key terms. Primary data Secondary data Discrete data Categoric data

E N D
Objectives • To consider the data handling cycle and the effective teaching of data handling • To clarify the terminology and conventions used for different tables, charts, graphs and diagrams.
Key terms Primary data Secondary data Discrete data Categoric data Continuous data Grouped data
The data handling cycle Posing the question Interpreting and discussing the data Collecting the data Analysing the data
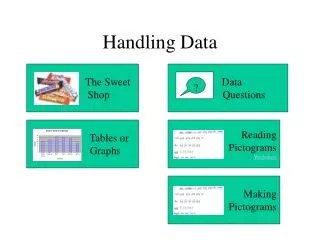
Types of graphical representation • Mapping or arrow diagram • Tally chart / frequency chart • Pictogram • Bar chart Bar line • Pie chart • Tree diagram • Venn diagram • Carroll diagram • Line graph
0 0 0 0 1 2 5 10 2 4 10 20 3 6 15 30 4 8 20 40 5 10 25 50 6 12 30 60 7 14 40 70 8 16 50 80 9 18 55 90 10 20 60 100
Issues from QCA • Children not given opportunity to decide on increment of • scale for axis; • Children told today we are going to draw a bar chart to • show rather than introducing through a problem to be • solved. They are not encouraged to think about the best • way of representing the different data; • Children only see bar charts where the bars are shown • vertically and not horizontally; • Children in Y6 required to consolidate previous knowledge • but children aren’t always consolidating understanding of • pictograms – even though they appear in the SATs.
Planning for handling data across the curriculum • Look at the different topics you will be teaching this term in all subjects. • Identify opportunities for data handling in different units of work. • Think about the range of graphs and charts the children will need to be familiar with. • Consider moving the data handling unit of work to ensure children have been taught the skills to apply to different subjects.
Key messages • Ensure progression and variety of presentation. • Use different sources of data so that children at KS2 don’t only use primary data. • Ensure there is enough time given to interpretation of data. • Use the knowledge and skills taught in Maths and apply them through different subjects. • Opportunities for data handling occur in most subjects. Make links explicit for the children.