Download
1 / 33
330 likes | 475 Views
Price outlook and volatility in global grain markets: Policies and other factors. by William H. Meyers Howard Cowden Professor of Agricultural and Applied Economics and Interim Director, Division of Applied Social Sciences At University of Missouri IVth Astana Economic Forum

E N D
Price outlook and volatility in global grain markets: Policies and other factors by William H. Meyers Howard Cowden Professor of Agricultural and Applied Economics and Interim Director, Division of Applied Social Sciences At University of Missouri IVth Astana Economic Forum Astana, Kazakhstan 3 May 2011
Agenda • What is going on? This is not like 2008 • Recent evidence • What is ahead for grain markets? • FAPRI 2010 - 2020 Baseline analysis • USDA comparisons • Volatile and uncertain future
Recent evidence • Financial crisis had very diverse impacts • Commodity prices very volatile and uncertain • Impacts of weather and government policies
Weekly Wheat Prices USDA Price Range $5.50 – 5.70/bu Basis -0.73
Weekly Corn Prices USDA Price Range $5.20 - $5.60/bu Basis -0.41
Weekly Crude Oil Prices West Texas Oil Avg for 2008 : $ 99.57 West Texas Oil Avg for 2010: $79.40 West Texas Oil Avg for 2007: $72.32 West Texas Oil Avg for 2009: $61.65 Projected U.S. Energy Information Admin Average for 2011: $106.38 Projected U.S. Energy Information Admin Average for 2012: $113.50
World Bank food, energy, metals price indices, 6/08 to 3/11, 2000=1
Wheat production and exports: Russia and Ukraine Source: USDA, PSD Online, April 2011
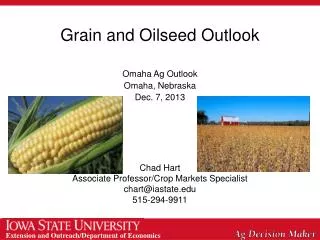
US corn yield estimates and producer corn prices, 2010-11 Source: USDA “WASDE,” various editions Source: USDA “Agricultural Prices,” various editions
Apr. production estimates Pdn. Wheat -35mmt, Coarse grain -24 Sply. Wheat – 4 mmt Coarse grain -23 Why prices are rising Reduced wheat production mainly in Russia, Kazakhstan, Ukraine and EU Policy intervention by Russia, Ukraine, also importers Reduced US maize yields But grain stocks are higher than in 2007/08 Biofuel feedstock growth Other demand growth • PRODUCTION • World wheat -35.6 mmt • World coarse grains -24.2 mmt • World rice +10.3 mmt • World total grain -49.5 mmt • SUPPLY=PDN + Stocks • World wheat supply -4.4 mmt • World coarse grains -22.9 mmt • World rice + 12.7 mmt • World total grain -14.6mmt
Good rice yield, so prices are more “relaxed” than wheat and maize, FAO
Policies and market volatility • Government policies can affect level, volatility of agricultural market prices • In 2007/08 and again in 2010/11, countries restricted exports and allowed more imports • This helped stabilize domestic markets • But increased volatility in world markets • Biofuel policies • Increase demand for corn, vegetable oil, etc. • Affect linkage between ag. & energy markets
Agenda • What is going on? This is not like 2008 • Recent evidence • What is ahead for grain markets? • FAPRI 2010 - 2020 Baseline analysis • USDA comparisons • Volatile and uncertain future
Baseline Assumptions • Agricultural Policies • Macroeconomic Variables • Technology • Weather
Macro outlook and Policy in the Baseline • GDP growth, exchange rates, inflation, etc come from January 2011 IHSGlobal Insight forecasts • Baseline assumes current policies remain in place, including expiration of US biofuel subsidies/duties • Changes that may come as result of WTO agreement or new legislation is a scenario of change from this baseline
Technology and weather in the Baseline • The baseline assumes average rates of technological change. • Among other things, this means that crop yields increase in line with historical trends and prices. • We also have to make assumptions for the productivity of livestock. • Normal weather is assumed BUT historical yield variations are used for sensitivity analysis
Main Factors in Price Strength • Strong economic recovery in Emerging Market Economies • Rising demand for grains, oilseeds, fiber • Slow pace of area and yield growth • Rising energy, processing, and transport costs • Increased sugar, grain and oilseed for biofuel • Trade interventions slow market response
Agenda • What is going on? This is not like 2008 • Recent evidence • What is ahead for grain markets? • FAPRI 2010 - 2020 Baseline analysis • USDA comparisons • Volatile and uncertain future
FAPRI 2011 Estimates of FOB Gulf wheat prices, stochastic range
FAPRI 2011 Estimates of FOB Gulf maize prices, stochastic range
Volatile and uncertain future Road to economic recovery? Timing and size of oil price volatility? How will exchange rates move? Will biofuel policies change? Will trade interventions continue? Climate change and weather impacts? Wider range of possible outcomes
Try to discern the music • Many years ago Professor Jim Houck told his students in Price Analysis class an analogy between prices and radio static. • “Sometimes”, he said, “the static is so loud that you cannot hear the music”. • Our challenge is to understand the music playing behind the daily static in the market
Challenge and Opportunity Challenge - how to provide safety net measures for the most vulnerable populations Opportunity - higher prices can increase availability and access Devise policy strategies that are sustainable in an unpredictable environment
Policy priorities • Short run • Avoid polices that conflict with long term development • Prudent use of limited budget resources • Continue and accelerate reforms • Complete the Doha Round of trade negotiations and restore trust in the international trading system • Food security safety nets and early warning
Policy priorities • Long run (but start yesterday) • Economic growth reduces poverty and food insecurity • Investment (public and private) in agric. development AND R&D for production and post harvest • Improve market functioning to facilitate price transmission and integration with global markets • Enhance rural development and rural infrastructure investments • Invest in social protection or safety net measures to protect vulnerable populations
Contact information:email: meyersw@missouri.eduweb: www.fapri.missouri.edu Thank you!