Download
1 / 54
540 likes | 648 Views
Rice Situation and Outlook Robert Coats, Professor and Extension Economist Southern Outlook Conference September 22- 24, 2008. Rice - protected commodity Given global food price inflation, the scattered global food riots, and now a global financial crisis

E N D
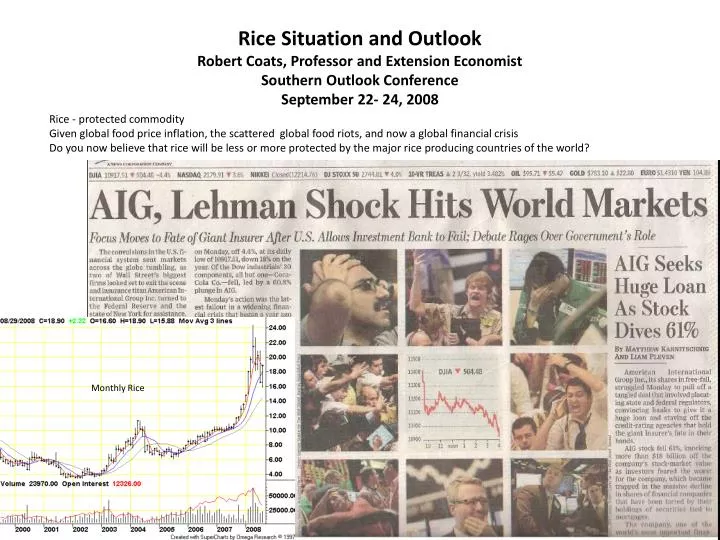
Rice Situation and OutlookRobert Coats, Professor and Extension EconomistSouthern Outlook ConferenceSeptember 22- 24, 2008 Rice - protected commodity Given global food price inflation, the scattered global food riots, and now a global financial crisis Do you now believe that rice will be less or more protected by the major rice producing countries of the world? Monthly Rice
U.S. Long Grain Rice Harvested By State 1996-2008, Thousand Acres Primary U.S. rice discussion will be on long grain rice
U.S. Medium Grain Rice Harvested By State 1996-2008, Thousand Acres
U.S. Short Grain Rice Harvested By State 1996-2008, Thousand Acres
U.S. All Rice Harvested Acres, 1972-2008 1,000 Acres U.S. rice acreage declines with increasing cost of production and increased price uncertainty
Rice, Weekly Food inflation/riots Corn, Weekly Soybeans, Weekly Wheat, Weekly
RICE: WORLD MARKETS AND TRADENominal Rice Quotes – 2007 to Present Thai 100% grade B U.S. long grain, No. 2, 4% Vietnam, 5 percent One Outcome From High Rice Price Was Food Riots
Why is there a rice supply problem? U.S. and global rice supplies are tight but adequate. Problem Hording, processing, distribution and/or availability
World Rice Milled Consumption and Production 1979/80 – 2008/09 Millions of Metric Tons 3 of 4 8 of 13
World Rice Ending Stocks 1978/79-2008/09 Millions of Metric Tons Global ending stocks are projected to increase 4% in 2008/09
World Rice Area Harvested 1978/79-2008/09 Millions of Hectares
World Rice Milled Production 1978/79-2008/09 Millions of Metric Tons
World Rice Trade Calendar Year 1980-2009 Millions of Metric Tons Protectionism Financial Crisis
U.S. Long Grain Rice Production 1982/83 – 2008/09 Million hundredweight All Rice 4
U.S. Long Grain Rice Total Supply 1982/83 – 2008/09 Million hundredweight 2
U.S. All Rice Imports1970/71 – 2008/09 Million hundredweight
U.S. Long Grain Rice Domestic and Residual 1982/83 – 2008/09 Million hundredweight 2
U.S. Long Grain Rice Total Exports 1982/83 – 2008/09 Million hundredweight Long Grain 3
U.S. All Rice Rough Exports 1970/71 – 2008/09 Million hundredweight 3
U.S. Long Grain Rice Total Use 1982/83 – 2008/09 Million hundredweight 3
U.S. Long Grain Rice Ending Stocks 1982/83 – 2008/09 Million hundredweight
World Rice Ending Stocks 1978/79-2008/09 Millions of Metric Tons Improvements in global supply and availability are projected… Global supply will remain tight but adequate Significant damaging global weather event would once again raise major concerns about supply availability
World Rice Milled Consumption and Production 1979/80 – 2008/09 Millions of Metric Tons The major rice producing countries stand ready to take any required action to maintain adequate production 3 of 4 8 of 13
World Rice Trade Calendar Year 1980-2009 Millions of Metric Tons Exporting countries have and will continue to meet their commitment… Slowing global economy… Results in drop in global rice prices Protectionism Credit Crisis
RICE: WORLD MARKETS AND TRADENominal Rice Quotes – 2003 to Present Thai 100% grade B U.S. long grain, No. 2, 4% Vietnam, 5 percent
U.S. Long Grain Rice Production 1982/83 – 2008/09 Million hundredweight USDA’s optimism about yields will not be realize which will provide rice prices some support
Dow Jones - Industrial Average More weakness than strength Chart courtesy of TradingCharts.com: http://futures.tradingcharts.com/
U.S. Dollar Index Chart courtesy of TradingCharts.com: http://futures.tradingcharts.com/
CBOT Corn Chart courtesy of TradingCharts.com: http://futures.tradingcharts.com/
CBOT Corn Chart courtesy of TradingCharts.com: http://futures.tradingcharts.com/
CBOT Wheat Chart courtesy of TradingCharts.com: http://futures.tradingcharts.com/
CBOT Wheat Chart courtesy of TradingCharts.com: http://futures.tradingcharts.com/
CBOT Soybeans Chart courtesy of TradingCharts.com: http://futures.tradingcharts.com/
CBOT Rough Rice Chart courtesy of TradingCharts.com: http://futures.tradingcharts.com/
CBOT Rough Rice Chart courtesy of TradingCharts.com: http://futures.tradingcharts.com/
U.S. Long Grain Rice Ending Stocks 1982/83 – 2008/09 Million hundredweight
Rice Long Grain Monthly Chart USDA 2008/09 $16.26 per cwt Market direction
Arkansas Long Grain Rice Harvested Acres and Percent of U.S. Long Grain Harvested Acres, 1972-2008 1,000 Acres September 1, 2008
California Long Grain Rice Harvested Acres and Percent of U.S. Long Grain Harvested Acres, 1972-2008 1,000 Acres September 1, 2008
Louisiana Long Grain Rice Harvested Acres and Percent of U.S. Long Grain Harvested Acres, 1972-2008 1,000 Acres September 1, 2008