Download
1 / 60
600 likes | 613 Views
Learn how to utilize SDSS data access tools for specific research questions on galaxies, interactive demos, and recent scientific findings. Dive into the Color-Magnitude Diagram and the challenges in galaxy evolution research.

E N D
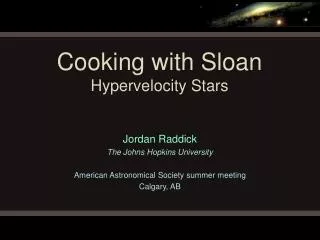
Cooking with SloanColor-Magnitude Diagram for Galaxies Jordan Raddick The Johns Hopkins University American Astronomical Society summer meeting Calgary, AB
Outline • Welcome and introduction • Set the table • Introduce the kitchen • Gather the ingredients • Enjoy the feast Cooking with Sloan: Color-Magnitude Diagram for Galaxies
Welcome • Purpose: Teach how to use SDSS data access tools for research • Rationale: Best to learn in specific context • Focus: Specific research questions • Rediscover recent interesting findings • Method: Interactive demo • Ask questions • Follow along on your laptop • Mood: fun Cooking with Sloan: Color-Magnitude Diagram for Galaxies
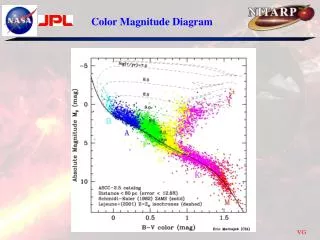
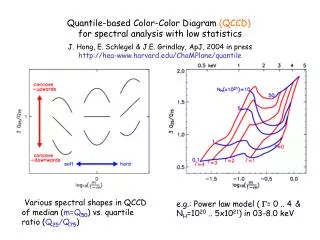
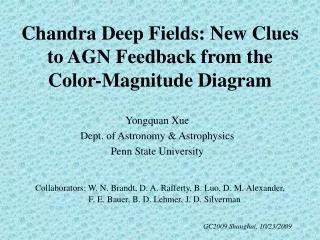
Scientific problems • Asteroid weathering • Nesvorny et al. 2005 • Hypervelocity stars • Brown et al. 2006 • Color-magnitude diagram for galaxies • Baldry et al. 2004 • Measuring the Hubble constant • Hubble 1929 Cooking with Sloan: Color-Magnitude Diagram for Galaxies
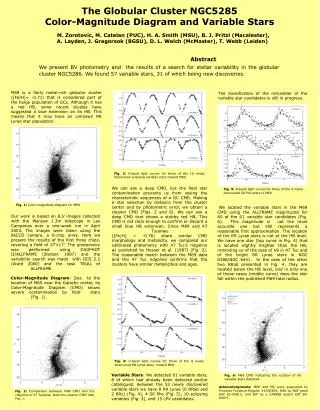
The Problem • Color-magnitude diagram of stars • Well-understood • Unlocked mysteries of stellar evolution • Picture for galaxies not so clear Cooking with Sloan: Color-Magnitude Diagram for Galaxies
The Problem • So how do we make progress? • One approach: morphology • But hard to get morphology of many small faint galaxies Cooking with Sloan: Color-Magnitude Diagram for Galaxies
One Solution • Get a representative sample • all galaxies in a certain magnitude range • Let’s try that approach with the SDSS Cooking with Sloan: Color-Magnitude Diagram for Galaxies
Introducing the SDSS Cooking with Sloan: Color-Magnitude Diagram for Galaxies
Participating Institutions • The American Museum of Natural History • Astrophysical Institute Potsdam • University of Basel • Cambridge University • Case Western Reserve University • University of Chicago • Drexel University • Fermilab • The Institute for Advanced Study • The Japan Participation Group • Johns Hopkins University • The Joint Institute for Nuclear Astrophysics • The Kavli Institute for Particle Astrophysics and Cosmology • The Korean Scientist Group • The Chinese Academy of Sciences (LAMOST) • Los Alamos National Laboratory • The Max-Planck-Institute for Astronomy (MPIA) • The Max-Planck-Institute for Astrophysics (MPA) • New Mexico State University • Ohio State University • University of Pittsburgh • University of Portsmouth • Princeton University • The United States Naval Observatory • The University of Washington (there are a lot of us) Cooking with Sloan: Color-Magnitude Diagram for Galaxies
The Telescope • 2.5 meter F/5 reflector • Very wide (~3 degree) field of view • Alt-az mount • Drift scanning Cooking with Sloan: Color-Magnitude Diagram for Galaxies
The Camera • CCD Imaging • 30 chips • 2048 x 2048 pixels • Arranged in six columns • Five rows for five filters: u, g, r, i, z • 54 second exposure time in each filter Cooking with Sloan: Color-Magnitude Diagram for Galaxies
Filter Profiles Cooking with Sloan: Color-Magnitude Diagram for Galaxies
Spectral Target Selection • All galaxies brighter than g < 17.77 • A luminous red galaxy sample • Quasar Candidates • “stars” with unusual colors • Objects with VLA FIRST or ROSAT matches Cooking with Sloan: Color-Magnitude Diagram for Galaxies
Spectrographs • Two fiber-fed spectrographs • Telescope tracks stars with plug plate in focal plane • Records 640 spectra simultaneously Cooking with Sloan: Color-Magnitude Diagram for Galaxies
Let’s start cooking… • Go to www.sdss.org • Read News • See Education • Click on Data Release 4 Cooking with Sloan: Color-Magnitude Diagram for Galaxies
Demo of DR4 site Cooking with Sloan: Color-Magnitude Diagram for Galaxies
Data Products Cooking with Sloan: Color-Magnitude Diagram for Galaxies
Data Access Methods • Data Archive Server (DAS) • http://das.sdss.org/DR4/data/ (or replace with DRx) • All the FITS data • Accessible via rsync, wget • Catalog Archive Server (CAS) • http://cas.sdss.org/ • All the catalog data (i.e. numbers) • Back end: MS SQL Server database management • Two distinct sites, both hosted at Fermilab • We’ll focus on the CAS Cooking with Sloan: Color-Magnitude Diagram for Galaxies
Why use databases? • Tycho Brahe’s notebooks • lifetime of work (1570-1601) • About 500 kB • POSS – 1950s • About 10 GB • SDSS – today • 3 TB • LSST – 2012 • 5 PB or more Cooking with Sloan: Color-Magnitude Diagram for Galaxies
Today’s tools, tomorrow’s data • You can… • GREP 1 MB in 1 second, FTP for < 1¢ • GREP 1 GB in 1 minute, FTP for $1 • GREP 1 TB in 2 days, FTP for $1,000 • GREP 1 PB in 3 years, FTP for $1,000,000 • …and 1 PB is 5,000 disks Cooking with Sloan: Color-Magnitude Diagram for Galaxies
Large-database science • Data in a database • Bring tools to data, not data to tools • Link data to literature Cooking with Sloan: Color-Magnitude Diagram for Galaxies
Types of Problems • Needles in haystacks • Brown dwarfs • Higgs particle • Disease-causing genes • Haystacks • Dark matter • Dark energy • Protein folding models • Needles are easier! • Our problem is “haystack” Cooking with Sloan: Color-Magnitude Diagram for Galaxies
Let’s see some galaxies… • Go to Catalog Archive Server (CAS) • Click “CAS” link on SDSS DR4 site • Go to http://cas.sdss.org • Go to www.google.com, type “CAS SDSS” • Notice Projects – great for your teaching! • Important: click “For Astronomers” • Now the site is optimized for you Cooking with Sloan: Color-Magnitude Diagram for Galaxies
Browse for Galaxies • http://cas.sdss.org/astro/ • Click on “Navigate” • Mapquest-likeinterface • Click on any object for data • Online notebook • Click “Explore” Cooking with Sloan: Color-Magnitude Diagram for Galaxies
Explore a Galaxy • Summary of image data and (if available) spectral data • Links to complete data • Get FITS of images (5 filters), spectrum Cooking with Sloan: Color-Magnitude Diagram for Galaxies
Explore a Galaxy • Links to NED, SIMBAD, ADS • Links to multiple SDSS observations • Print Cooking with Sloan: Color-Magnitude Diagram for Galaxies
Observe this Galaxy • Click image to go to Finding Chart • Enter ra, dec, scale (arcsec / pixel), image width • Print (inverted) • Point your telescope! Cooking with Sloan: Color-Magnitude Diagram for Galaxies
Searching the Database • Repeat as many times as you need to • But… there are 100 million galaxies! • How do you search the database? Cooking with Sloan: Color-Magnitude Diagram for Galaxies
Imaging Query Cooking with Sloan: Color-Magnitude Diagram for Galaxies
Spectro Query Cooking with Sloan: Color-Magnitude Diagram for Galaxies
Searching for Galaxies • Constraints from Baldry et al (2004): • Clean photometry (not NOPROFILE, PEAKCENTER, NOTCHECKED, PSF_FLUX_INTERP, SATURATED, or BAD_COUNTS_ERROR, DEBLEND_NOPEAK, or COSMIC_RAY) • Spectra available • In main galaxy sample (primTarget = GALAXY but not GALAXY_RED) Cooking with Sloan: Color-Magnitude Diagram for Galaxies
Searching for Galaxies • Constraints from Baldry et al (2004): • 13.5 < r < 17.77 • 0.004 < z < 0.08 • zconf > 0.35 • -23.5 < Mr < -15.5* • *to simplify, let’s assume Hubble cosmology: • -23.5 < r - 5*log10(4.27E+08*z) < -15.5 • Wait… you can’t specify that in the IQS! Cooking with Sloan: Color-Magnitude Diagram for Galaxies
SQL Searching • SQL – Structured Query Language • Common database access language • Industry standard, so students have practical advantages to learning • Allows advanced searches (“queries”) of data • Search using constraints on any variable • Return any or all types of data Cooking with Sloan: Color-Magnitude Diagram for Galaxies
SQL Concepts • Data are stored in a database • Similar data types are stored in tables • photoObj (photometry), specObj (spectroscopy), etc. • A VERY small part of the photoObj table: Cooking with Sloan: Color-Magnitude Diagram for Galaxies
SQL Concepts • Within a table: • Horizontal rows are individual data points, or records • Vertical columns are types of data, or columns • A request to a database to return data is called a query • Queries usually request data that meets certain constraints Cooking with Sloan: Color-Magnitude Diagram for Galaxies
SQL as a foreign language • Languages have grammar and vocabulary • Dutch grammar • With modal verb, auxiliary verb goes at the end • English: • I want TO SEE star positions. • Dutch: • Ik wil de posities van de sterren ZIEN. Cooking with Sloan: Color-Magnitude Diagram for Galaxies
SQL Grammar • Select – choose which columns of data you want to see • From – choose the table(s) from which you want to retrieve data • Where – set constraints on the search Cooking with Sloan: Color-Magnitude Diagram for Galaxies
Dutch vocabulary Cooking with Sloan: Color-Magnitude Diagram for Galaxies
SQL Vocabulary Cooking with Sloan: Color-Magnitude Diagram for Galaxies
Translations • English: • I want to see positions of 15th magnitude stars. • Dutch: • Ik wil de posities van de 15de magnitude sterren zien. • SQL: • select ra, decfrom starwhere r between 15 and 16 Cooking with Sloan: Color-Magnitude Diagram for Galaxies
SQL Help Resources • See Help link on SkyServer • Introduction to SQL • How-to -> Searching for Data • Sample SQL Queries • Query Limits • To submit a query, go to Tools -> Search -> SQL Search Cooking with Sloan: Color-Magnitude Diagram for Galaxies
Galaxy CMD Query select objid,ra,dec, modelmag_u,modelmag_g,modelmag_r,modelmag_i,modelmag_z, z,4.27E+3*z as d_hubble_mpc, modelmag_u-modelmag_r as u_minus_r, modelmag_r-5*log10(4.27E+8*z) as abs_mag_r from specphoto where specclass=2 AND modelmag_r between 13.5 and 17.7 AND ((flags & 0x10000000) != 0) AND ((flags & 0x8100000c00a0) = 0) AND (((flags & 0x400000000000) = 0) or (psfmagerr_g <= 0.2)) AND (((flags & 0x100000000000) = 0) or (flags & 0x1000) = 0) AND (primtarget & 0x00000040) > 0 AND (primtarget & 0x00000020) = 0 AND zConf > 0.35 AND z BETWEEN 0.004 and 0.08 AND modelmag_r - 5*log10(4.27E+08*z) BETWEEN -23.5 and -15.5 Cooking with Sloan: Color-Magnitude Diagram for Galaxies
First, a sanity check… • Advanced Tools -> Image Lists • Use query to fill form • Two changes • Add “TOP 50” • Select block must be ONLYname, ra, dec Cooking with Sloan: Color-Magnitude Diagram for Galaxies
We’re sane! Cooking with Sloan: Color-Magnitude Diagram for Galaxies
Running the Query • How many galaxies will we get? • Select count(*) ->n = 86,478 • That’s too many to use web browser • Solution: CasJobs Cooking with Sloan: Color-Magnitude Diagram for Galaxies
CasJobs • Advanced Tools -> CasJobs • Best method for fairly long, complex queries • Personal user DB (MyDB) • Quickmode: 1 minute cutoff (don’t need to register) • Register for… Cooking with Sloan: Color-Magnitude Diagram for Galaxies
CasJobs • Advanced Tools -> CasJobs • Submitmode: up to 8 hours in “long” queue • MyDB database to save results of your queries • Define your own functions, procedures • Share tables with collaborators (groups) • Job history, plotting, FITS/CSV/VOTable output Cooking with Sloan: Color-Magnitude Diagram for Galaxies
Run the Query in CasJobs • Go to “Query” • Select “DR4” as “Context” • Give results table a name (for your MyDB) • Give your query a name • Wait until it says “started” • Go play outside • When you return, results will be in MyDB Cooking with Sloan: Color-Magnitude Diagram for Galaxies
Results • Query ran in 1 min. 59 sec. • Varies due to server load Cooking with Sloan: Color-Magnitude Diagram for Galaxies
CasJobs Options • View data(preview) • Query your MyDB (just like SDSS tables) • Change context to “MyDB” • Job shows how table was created • Plot creates a simple x-y plot • Download lets you download data • CSV, FITS, XML • Neighbors lets you search around each object Cooking with Sloan: Color-Magnitude Diagram for Galaxies