Download
1 / 64
640 likes | 778 Views
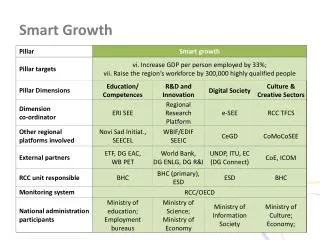
Smart Growth Economics. February 29, 2012. Key Concepts. Convergence Reduced Cost Increased Revenue Productive vs. New Revenues A “Plan” Land Use / Finance / Services. Key Concepts (Cont’d). Diversity 5 “D”s 2 “E”s Environmental Energy Energy Market Do You Have A “New Market”?

E N D
Smart Growth Economics February 29, 2012
Key Concepts • Convergence • Reduced Cost • Increased Revenue • Productive vs. New Revenues • A “Plan” • Land Use / Finance / Services
Key Concepts (Cont’d) • Diversity • 5 “D”s • 2 “E”s • Environmental • Energy • Energy • Market • Do You Have A “New Market”? • Sell Your Plan
Presentation Overview Productive Revenues 1 2 Reduced Infrastructure Needs/Cost 3 Environmental Benefits 4 Communicating the Benefits
Smart Growth Defined • Smart Growth Characteristics (Ewing & Cervero): • Destination Accessibility • Design • Diversity • Distance to Transit • Density
Economic Development 5D’s • Destination Accessibility • Design • Diversity • Distance to Transit • Density Enhanced Revenues Reduce Costs and Environmental Impacts Economics
Productive Revenues • Primary Revenue Sources Available: • Property Tax • Sales Tax • Gas Tax • Which Revenue Sources Are Enhanced with Smart Growth Initiatives?
Property Taxes • Property Taxes • Enhanced with Destination, Diversity, Design, and Density • Enhanced Over Time
Legend Single Use Areas Example: City of Orlando Smart Growth Application - Single-Use
Legend Mixed Use/TOD Example: City of Orlando Smart Growth Application - Mixed-Use A2 A3 C2 C3 C1 A1
Example: City of Orlando Property Tax Revenue Per Acre A3 A2 C3 C2 C1 A1
City of Sarasota: Property Tax Value per Capita -- Above the State Projected
City of Sarasota Property Tax Value Single Use District
City of Bartow: Property Tax Value per Capita -- Below the State Projected
City of Bartow Property Tax Value Annex Area
Osceola County: Property Tax Base Distribution Source: Florida Property Valuations and Tax Databook
Marion County: Property Tax Base Distribution Source: Florida Property Valuations and Tax Databook
Property Taxes • Property Taxes • Taxable Value of New Homes Are Higher • Larger Structures • More Valuable Structures • Generate More Tax Revenues • Statewide Per Capita Property Tax Increased by 5% Annually Past 15 years
Home Values – Example Community • Average Value of All Homes vs. New Homes • The average square footage of a new single-family home 1950 1970 1990 2004 983 sq.ft. 1,500 sq.ft. 2,080 sq.ft. 2,349 sq.ft. Source: National Association of Home Builders (Housing Facts, Figures and Trends for March 2006)
Property Taxes -- Taxable Value per Capita Collier Sarasota Palm Beach Lee
Property Taxes -- Taxable Value per Capita vs Median Income per Capita Collier
Sales Taxes • Sales Taxes • Related to Income Levels • Enhanced with Density • Per Capita Increase Over Time
Sales Tax Revenue per Capita Orange
Sales Tax per Capita vs Median Income per Capita Orange Osceola
Median Income per Capita Collier Martin Palm Beach Sarasota Indian River
Gas Taxes • Gas Taxes • Related to Travel (per Gallon Charge) • Reduced with Density • Per Capita Decrease Over Time with Fuel Efficiency
County Fuel Tax per Capita Highlands Sumter
Presentation Overview Productive Revenues 1 2 Reduced Infrastructure Needs/Cost 3 Environmental Benefits 4 Communicating the Benefits
Reduced Infrastructure Needs 5D’s • Destination Accessibility • Design • Diversity • Distance to Transit • Density Enhanced Revenues Reduce Costs and Environmental Impacts Economics
Reduced Infrastructure Needs • Services Related to Densities/Intensities • Fire, Parks, Schools • Smaller service areas = cost savings • Reduced public investment, reduced VMT
Reduced Infrastructure Needs Status Quo Example Community ~2 du/acre/6 sq. miles Fire Station 1/3 ElementarySchool 1/2 1/10 Middle School High School 1/10
Reduced Infrastructure Needs Maximize Allowable Density 4 du/gross acre/6 sq. Miles Fire Station 1 Transit Service Density Thresholds ElementarySchool 2 Middle School 1/2 1/2 High School
Reduced Infrastructure Needs Increase Allowable Density 8 du/gross acre/6 sq. miles Fire Station 2 Transit Service Density Thresholds ElementarySchool/Parks 4 Middle School 1 1 High School
Reduced Infrastructure Needs • Opportunity for Public Investment Savings • Public school sites • Provide park amenities, reduce need other parks • Proximity to residential increases walkability • Fire station location • Critical to response time
Fire/EMS – LOS vs. Revenue Needs • Collier County Fire Control Districts
Fire/EMS Services - Savings • Savings with Density: • Better ISO rating – Lower Insurance Rates • For a $150K Home Up to $600 Per Year • Lower Assessment Rates • Up to $100 to $200 per Year
Monthly Transportation Expenses($ of income) 2000 2008 Source: Center for Neighborhood Technology, Housing and Transportation Index (H+T Index)
Monthly Housing Expenses (% of income) 2008 Source: Center for Neighborhood Technology, Housing and Transportation Index (H+T Index)
H+T Affordability Index(% of income) 2008 Source: Center for Neighborhood Technology, Housing and Transportation Index (H+T Index)
No Regional Park Presence Area of Future Growth Collier County Parks and Recreation 10-Year Master Plan
Ewing & Cervero Study • VMT Elasticity Source: Ewing and Cervero; “Travel and the Built Environment”
Example Community • Transit Service Density Thresholds
Smart Growth Approach • Single Family Fee vs. Average Annual Growth Rate Maintain Level of Service Curve Area 1 Maximum Impact Fee 10% Credit Avg. Level-of-Service Curve County Avg. Area 2 Area 3
Presentation Overview Productive Revenues 1 2 Reduced Infrastructure Needs/Cost 3 Environmental Benefits 4 Communicating the Benefits
Environmental Benefits • Environmental Benefits: • Reduced Footprint • Fewer Impacts on Habitat/Wetlands • Reduced Travel/VMT • Reduced Greenhouse Gases
Connectivity • Conceptual Illustration of Sub-Area Connectivity Test *VMT = Vehicle Miles of Travel **VHT = Vehicle Hours of Travel
Transfer of Development Rights • Potential TDR Area • Limited services and infrastructure • Transfer density to urban area • Existing services and infrastructure • Higher land values • Protect watershed/habitat
Presentation Overview Productive Revenues 1 2 Reduced Infrastructure Needs/Cost 3 Environmental Benefits 4 Communicating the Benefits