Download
1 / 53
690 likes | 1.21k Views
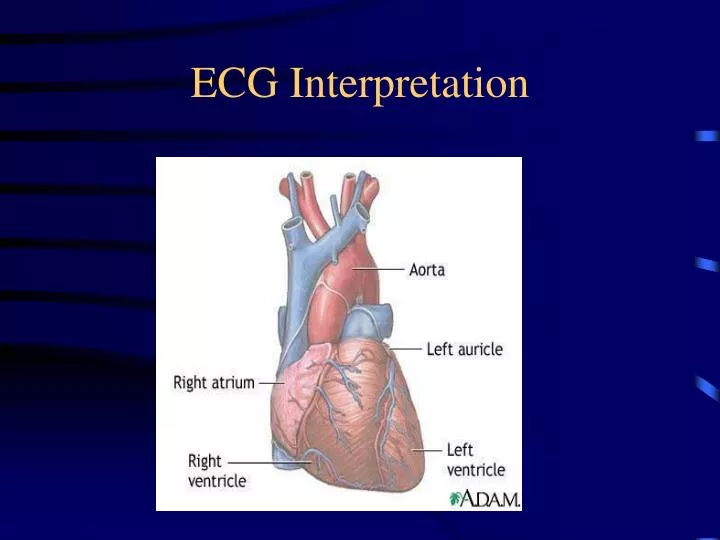
ECG Interpretation. What is an ECG. Electrocardiogram Traces the electrical activity of the heart 12 lead, 15 lead. Uses of ECG Tracing. Ischemia/infarct Arrhythmias Ventricular and atrial enlargements Conduction defects Pericarditis Effects of some drugs and electrolytes. ECG.

E N D
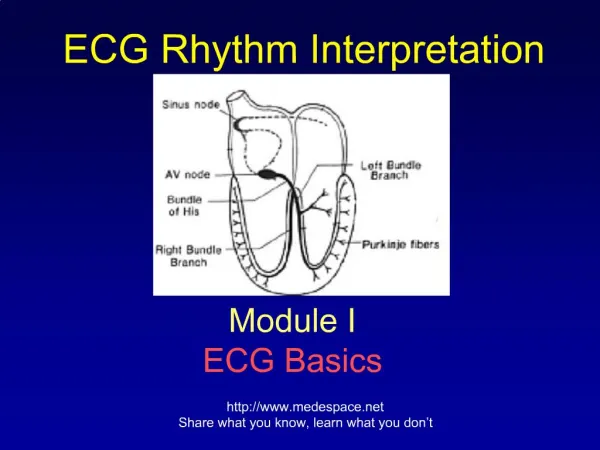
What is an ECG • Electrocardiogram • Traces the electrical activity of the heart • 12 lead, 15 lead
Uses of ECG Tracing • Ischemia/infarct • Arrhythmias • Ventricular and atrial enlargements • Conduction defects • Pericarditis • Effects of some drugs and electrolytes
How to Conduct an ECG • Patient lies flat on back • Electrodes are placed on the body • Sites may need to be shaved or cleaned to ensure the leads will stick properly. • Patient will lie as still as possible, hold breath, or put hands under bottom to keep from moving. • The results are then printed out on paper for MD to review.
Lead Placements • V1 - Junction of the 4th ICS, Right sternal border • V2 - Junction of the 4th ICS, Left sternal border • V3 - Midway between V2 and V4 • V4 - Junction of 5th ICS, Mid clavicle • V5 - Anterior aspect of axilla, same line as V4 • V6 - Mid axilla, same line a V4 • 4 limb leads (for grounding etc)
Each wave • P • Q • R • S • T
Understanding the Waves • One small box = 0.04 seconds • One large box = 0.2 seconds • 5 large boxes = 1 second
Understanding the Waves • Baseline (what is it?) • P wave • Length of time it takes the impulse to pass from the SA node to the AV node • Should precede every QRS wave • PR interval • Should be no longer than 0.12 – 0.2
Understanding the Waves • QRS • Should be no longer than 0.12 • If energy is going towards a positive electrode (camera), the picture will show a positive QRS complex • If energy is going away from positive electrode, the picture will show a negative QRS complex • If energy is toward the positive electrode and then passes by it, the QRS will be biphasic • Ventricle contracting
Understanding the Waves • T wave • Should always start from baseline • Will indicate ischemia
Understanding an ECG • Is as easy as… 1. 2. 3. • = rate • = intervals • = rhythm
Step 1 = Rate • Different ways to calculate a rate: • a) ECG usually tells you • b) Locate a QRS that is close to a big line and count to next big line: 300, 150, 100, 75, 60, 50 • c) take a 6 second strip, count QRS and multiply by 10 (hint: the middle of V3 on the lead II strip is 6 seconds)
Step 1 = Rate (cont’) • Checking the regularity: • map out QRS’s
Step 2 = Intervals • We assess intervals to see where the impulse is coming from (pacemaker beat) • Remember: • PR interval: normal is 0.12 - 0.2 • QRS interval: normal is less than or equal to 0.12
Step 3 = Rhythm The biggest question in relation to rhythm is…
(Normal) Sinus Rhythm • 60-80 bpm • P preceding each QRS • Normal intervals
Other Sinus Rhythms • Sinus bradycardia • a sinus rhythm with a rate <60 bpm
Other Sinus Rhythms • Sinus tachycardia • a sinus rhythm with a rate >80 bpm
Atrial Arrhythmias • Atrial fibrillation (A-fib) • irregular rate • no discernable P waves • increased risk of strokes due to clots that might form due to fibrillation (patients are usually on anticoagulation therapy)
Atrial Arrhythmias Cont’ • Atrial flutter • saw tooth in appearance • irregular rate
Blocks • 1st degree AV block • a PR interval that exceeds 0.20 sec
Blocks Cont’ • 2nd degree AV block (Mobitz) • a) type I (Wenckebach) • longer and longer PR intervals until a QRS is dropped
Blocks Cont’ • b) type II • P waves and then suddenly a QRS is dropped • P’s are regular
Blocks Cont’ • 3rd degree AV block • HR <40 bpm • a complete block of electrical activity from atria to ventricle • P’s are regular
Ventricular Rhythms • Ventricular fibrillation • complete breakdown of all rhythm • a) course • b) fine
V-fib • What’s the first thing to do when coming up on a patient with this rhythm?
Ventricular Rhythms Cont’ • Ventricular tachycardia (V-tach) • impulse originates in the ventricle • always has a wide QRS complex
V-tachWhat’s the first thing to do when coming up on a patient with this rhythm?
Asystole • Pulseless
MI’s • How can you tell on an ECG that your patient is having a heart attack? • T waves • Different views of heart will show different injured areas of heart
MI’s • T wave shouldering is classic
MI’s • How else can you tell that your patient has had an MI? • Cardiac Markers • CK will show in 4-6 hours (starts to come back down after 1 day) • Troponin will show in 4-6 hours (may stay elevated for weeks) • Others are: LDH, CK-MB, myoglobin, AST