Download
1 / 37
370 likes | 471 Views
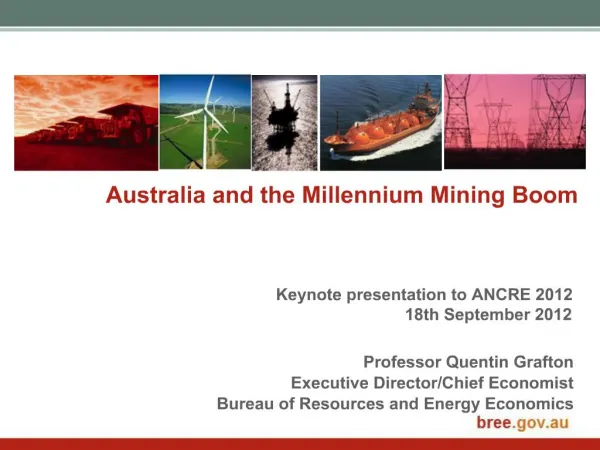
Australia and the Millennium Mining Boom. Professor Quentin Grafton Executive Director/Chief Economist Bureau of Resources and Energy Economics. Keynote presentation to ANCRE 2012 18th September 2012. Overview. I. Price Forecasting - Best and Worst of Times

E N D
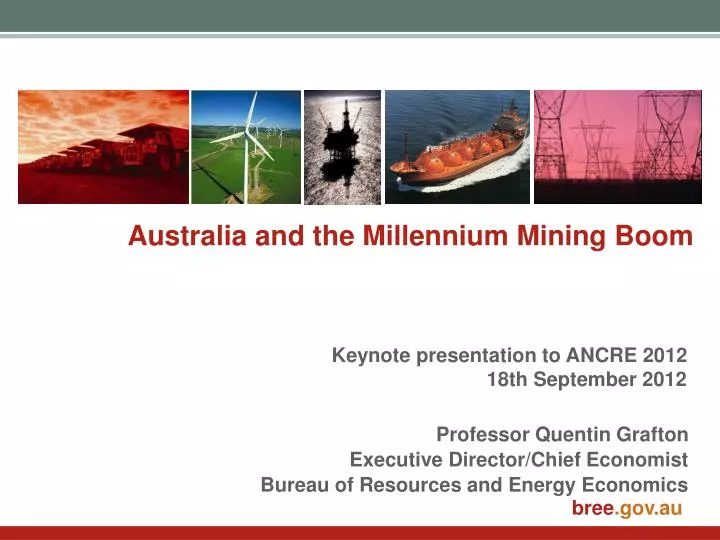
Australia and the Millennium Mining Boom Professor Quentin Grafton Executive Director/Chief Economist Bureau of Resources and Energy Economics Keynote presentation to ANCRE 2012 18th September 2012
Overview I. Price Forecasting - Best and Worst of Times II. Macroeconomic Outlook & Overview III. Millennium Mining Boom IV. Sustaining Australia’s Future V. Closing Remarks
“Boom still on boil” AFR 10/9/12 “Iron ore prices have recovered some ground” The Australian 12/9/12 “The mining boom will not go on forever” BHP Billiton chairman Jacques Nasser Adelaide Advertiser 13/9/12
Selected commodity prices: peaks & troughs (nominal US dollars) Notes: prices are from the following dates Copper: 3-Jul-2008 24-Dec-2008 14-Feb-2011 29-Aug-2012 Aluminium: 11-Jul-2008 24-Feb-2009 28-Apr-2011 29-Aug-2012 Zinc: 24-Nov-2006 12-Dec-2008 7-Jan-2010 29-Aug-2012Nickel: 16-May-2007 24-Oct-2008 21-Feb-2011 29-Aug-2012 Uranium: Jun-2007 Mar-2009 Jan-2011 Aug-2012 Source: BREE
Tianjin Iron Ore Spot Prices (CFR) Source: Bloomberg
Historical Iron Ore Prices Source: BREE
Iron ore price & USD/AUD exchange rate Correlation coefficient 0.74 Source: BREE
What if? Iron ore prices and exchange rate Source: BREE
Economic Growth in Key Export Markets Source: IMF; BREE
10 year bond yield spreads to Germany Source: Bloomberg
Debt Cycles and the Burden on Central Banks Source: Bank of International Settlements
Value of R & E exports: actual & forecast Source: BREE
Volumes, Prices & Values of Key Exports Source: BREE
Australia’s Terms of Trade Source: BREE; RBA
Australian Merchandise Exports to China ($2010-11) Source: BREE
Economic Variables: Before & During Boom(1.00 = initial year) Source: BREE; ABS
Mean Weekly H-Hold Income ($2011-12) Source: BREE; ABS
Value of Exports ($2011-12) and Mining Employment Source: BREE; ABS
Commodity Prices (real): Past Trends & Projections Source: BREE
Australian Capital Expenditures in Mining and Completed Major Mining Projects ($2011-12) Source: BREE; ABS
Cumulative real value of completed projects ($2011-12) Source: BREE
Prospects: Value of advanced projects if NO NEW projects were announced ($2011-12) Source: BREE
Commodity Production: Past Trends Source: BREE
Bulk Commodities Exports Source: BREE
Phases of the Millennium Boom bree.gov.au Source: BREE; ABS
Nineties versus Noughties Contributions to growth in average incomes by decade (percentage points, annual average) 4 3 ] Contributed 1.2% per year growth in average incomes GNI per person 2 1 Labour productivity 0 Terms of trade Labour utilisation Foreign income flows - 1 1990s 2000s Source: Australian Treasury
Three Ps: 1992-2002 and 2002-2012 Population Income 16% 12% Participation Terms of Trade 86% 3% 46% 1% 49% 4% Productivity 18% - 3% 1992-2002 Income: Real gross national income: Chain volume measures Productivity: Multifactor productivity, quality hours adjusted hours worked 2002-2012 Source: BREE; ABS
Productivity Growth Productivity growth is supported by public and private sectors working together to: (1) Avoid infrastructure bottlenecks; (2) Ensure a tax system that rewards & supports productive activities; and (3) Skills & innovation framework for students and workers and that encourages R&D and on-the-job innovation
Potential outcomes for income growth Maintain 2011-12 Goldilocks 3.7% Terms of Trade Productivity Agenda Bears ‘Bad News’ Decline High (1990s) Low (2000s) Productivity Growth Source: BREE
V. Closing Remarks Millennium Boom has been unambiguously good for the Australian economy with real income growth of about 40% over the past decade. The ‘easy’ gains of ever increasing real prices is past. Forecast declining terms of trade requires Australia to substantially increase its productivity growth. Investment phase of the boom has not yet peaked. Past and current mining investments could eventually lead to tripling of Australia’s export volumes from start of Millennium Boom to the 2020s.
Thank You • (quentin.grafton@bree.gov.au)