Download
1 / 61
610 likes | 735 Views
SHEEO 2004 Annual Meeting. The States and Higher Education: What is the future of this relationship?. Presenters. Katharine C. Lyall, President University of Wisconsin System Kathleen R. Sell, fmr. Assoc. Vice President University of Wisconsin System

E N D
SHEEO 2004 Annual Meeting The States and Higher Education: What is the future of this relationship?
Presenters • Katharine C. Lyall, PresidentUniversity of Wisconsin System • Kathleen R. Sell, fmr. Assoc. Vice PresidentUniversity of Wisconsin System • David W. Breneman, DeanCurry School of Education, Univ. of Virginia
Setting the stage • Roderick G. W. Chu, ChancellorOhio Board of Regents
BUT HIGHER EDUCATION HAS BEEN RECEIVING A Declining share of state resources
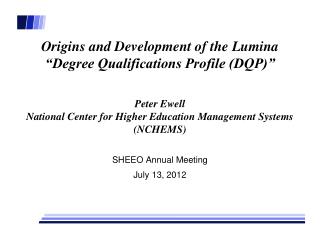
$30.7 billion in total income lost by Ohioans last year Ohio Per Capita Income AssociateDegree Attainment Bachelor’sDegree Attainment $1.5 billion in state revenuelost by Ohio last year WE’RE REGOGNIZING THE CONNECTION BETWEEN Income and Education Income and Education 120% 110% U.S. Average Percent of national average 100% 90% 80% 1940 1950 1960 1970 1980 1990 2000 Source: U.S. Census Bureau, 2000
WILL THESE TRENDS CONTINUE IN LIGHT OF Higher education’s changed role? “It was once the role of Governments to provide for the purposes of universities. It is now the role of universities to provide for the purpose of Governments.” Sir Howard Newby Higher Education Funding Council for England
Preview of a new study • Katharine C. Lyall, PresidentUniversity of Wisconsin System • Kathleen R. Sell, fmr. Assoc. Vice PresidentUniversity of Wisconsin System
We Aren’t in Kansas Anymore Preparing for Change Katharine C. Lyall Kathleen R. Sell
The Issue States are struggling to support public higher education as: • Enrollment demand grow • Competing budget claims grow • State budgets become structurally obsolete
State experiences differ, but national trends show: • Shifting state priorities • Declining tax effort for HE/$1000 income • Rising student share of cost • Consumer demand for convenience, access, and quality
The Likely Effects of Higher Education Budget Cuts are also significant policy issues: • Increased drive for autonomy • Donor unwillingness to substitute for state • Disguised policy shifts
Disguised policy shifts include: • Movement of star faculty and best students to private Higher Education • Declining share of low income and perhaps minority students in four-year publics • Shifting students from 4 year to 2 year institutions--will negatively affect per capita income over time
Disguised policy shifts include: • Medicaid and tax cuts are replacing higher education as a priority, without discussion • Intergenerational shifts (lower tax burdens now traded for higher tuition now, perhaps less college access, and higher tax burdens later for our current and future students)
The Perfect Storm: 9 Elements Fundamental assumptions are changing: • Growing consensus that the benefits of higher education are private or personal.
Changing assumptions … • Despite economic rebound, states remain in structural budget trouble • Revenues based on declining economic sectors (mfg., agriculture, minerals) • Loss of sales tax revenue to the internet • Long-term effects: tax cuts, loss carryovers outdated exemptions, TABOR • Double revenue whammy of phased in tax cuts in the 1990s and the recession’s effects on state funds’ interest earnings • Low if any rainy day funds
Changing assumptions … • The growing demand for more spending on prisons, Medicaid, K-12 education. • Increasingly, politicians on both sides of the aisle appear to favor tax cuts
Changing assumptions … • State tax policies are not appropriately designed for the realities of the 21st century: • They don’t keep up with the shift of commerce to the Internet; • Reductions in state personnel have increased tax collection problems; • We are losing tax code progressivity, • And there are other tax policy and tax structure problems.
Changing assumptions … • Higher education as residual item: 2.5 decades of budget cuts, jerk & fit budgeting. • Governors and legislators state that higher education is a prime area to cut because “it has other revenue sources.” • Higher education is moving to more costly production functions: higher productivity at higher cost. • We’ve differentiated revenue sources; these aren’t fungible; “a buck is NOT a buck.”
The Case Against “No Growth” (or “At Inflation”) Funding for the Changing Higher Ed Industry
The Case … • By SHEEO measures (HECA), state appropriations per student to higher education have not kept up with inflation (7.3% below 1991 levels). • These numbers are before 2004 budget cuts. • 91-03: 74% of states cut SPS (SHEEO). • 03-05: further cuts, 23 states. • While revenues are improving, states face increased Medicaid costs and continued write-offs of stock losses for years to come.
The Case … • This is not “rebounding consistently.” • In fact, continuing the 1978-2004 higher ed funding trend, 7 states get to zero state higher ed funding by 2030, and 20 get there by 2050, including California, Washington and Oregon (Mortenson).
Should we be content with this? No, because: • As noted, 37 of 50 states have declined in support per student (HECA measure) • 10 states are 20% - 42.6% below, and 24 are at 10% or more below. • Even considering net tuition, total education funding per FTE has fallen in 2002 and 2003 (and will in 2004, perhaps in 2005).
Should we be content with this? No, because: • Five states already rely on net tuition for 50% or more of their total educational revenue, and 15 states for 40% or more (gross tuition would presumably increase the number of states).
State Tax Appropriations to Higher Education (per $1,000 personal income) FY 1962 to FY 2004
Re: Tax Appropriation Effort per $1000 income • Tax effort must be looked at over time, and reflects both state circumstances and actual priorities. The latter seem especially salient, because: • By 2003, only 2 states (Kentucky and New Mexico) had higher effort than in 1978. Forty-eight had cuts of 4.6% - 54.7%. • The average cut in state higher ed. funds per $1000 income FY78-FY04 is 35.6%.
Re: Tax Appropriation Effort per $1000 income • Trend data from Mortenson show that today’s level of effort per personal income returns higher ed appropriations to 1968 levels. • Effort has declined by more than 30% since the high year of 1978.
Growing Number of States Give Absolute Cuts to University Appropriations
100% 90% 80% 48.6% 52.5% 70% 60% 50% 40% 36.1% 29.8% 30% 20% 10% 17.7% 15.3% 0% 1990-91 2000-01 Gifts, Grants, Contracts Financial Aid, Auxiliaries/Fees for Service Appropriations Source: Travis Reindl, American Association of State College and Universities Tuition Public Higher Ed Funding Sources Changing Quickly
THE PINCERS Source: RAND, Breaking the Social Contract, Figure 11
Many advise us not to use the “P” word (privatization). • But….
Critical Consequences w/oA Public Debate • Reductions in state funding commitment to public higher education have not been accompanied by a public debate. • Far-reaching decisions about the sources of funding for public higher education, with their necessarily long-term impact, need to be debated, with broad public input. • De facto privatization IS happening.
What are our real options? • Curl up into the fetal position and wait • Argue for higher education’s “fair share” of any revenue growth, and be happy … until the next cut • Engage public in open discussion: seek common goals • Redefine what a “new public purpose university” can be/do.
Empiricism versus Denial: Privatization Already Underway • Univ. of Colorado Enterprise Status and Voucher System University of Virginia • Darden School of Business spins off to private status • South Carolina Governor offers privatization or re-centralization • Hybrid Universities, Deregulation, and Tuition Deregulation with Limits
If States Remain Minority Stakeholders:Alternative Strategies to Consider • Maintain Public Universities by Raising Private Endowment Levels (flagships) • Downsize Along with Other Functions of State Government • Renewed State Compact for Higher Education Funding • Charter Status in state constitutions
If States Remain Minority Stakeholders:Alternative Strategies to Consider • Cornell & Virginia Model: Public University with Some Private Divisions • Variations: The Hybrid University, Enterprise & Exemplary Status • Private Divisions
Seamless Education Models with Majority State Ownership: • Alternative Models to Consider • Guaranteed PK-14 Education: A Recognition of Market Demand • State PK-16 Funding Formula • Education as Airline: State Purchase and Demand Pricing • State Voucher Approach
The New Public Purpose U. • We must provide the vision, sell it to others • Public will accept our vision, but pay only for parts of it • Statewide systems are needed to forge statewide solutions, address and balance regional needs
A Statewide Public Purpose U. Must: • Be competitive in the larger higher education market • Aggressively seek productivity and use savings • Ensure equitable access • Emphasize quality — manage enrollments
A Statewide Public Purpose U. Must: • Allocate public foci by institution, region — nimbly adjusting as situations change • Provide different percent of state support by institution (more to institutions less able to fundraise and raise tuition) • Help the state become a focused consumer of higher education • Stabilize support for the core instructional mission
A Statewide Public Purpose U. Must: • Pursue management flexibility • Have a governing board representing major stakeholders (taxpayers, students, alumni, donors) in a manner more proportionate to their investment
The all-things-to-all-people public university is not going to persist. • But this can be seen as an opportunity, rather than solely as a crisis.
Questions … • How to speak about changes and opportunities constructively? • How to help states address long-term fiscal restructuring?
The Response • David W. Breneman, DeanCurry School of Education, Univ. of Virginia