Download
1 / 11
110 likes | 316 Views
Buck UP. Population Dynamics and Slope. Levi Patrick | K20 Center at OU | 405.325.2720 | lpatrick@ou.edu. Biology + Algebra @ US Grant. Suppose You ’ re A Deer. Each ______ represents a _________. Each __________ represents a ________.

E N D
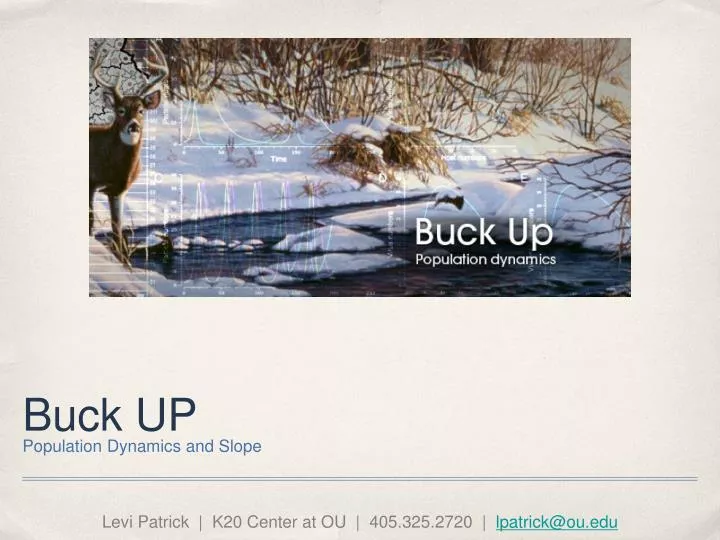
Buck UP • Population Dynamics and Slope Levi Patrick | K20 Center at OU | 405.325.2720 | lpatrick@ou.edu
Suppose You’re A Deer... • Each ______ represents a _________. • Each __________ represents a ________. • To feed yourself, grab bean and place it in your dear. • > 1 bean will cause your deer’s stomach to __________ ... it’s science. • If the Number of Beans in Your Cup After 1 Minute = b, then the following is true: • b < 20 ; • b = 20 ; • 20 ≤ b < 40 ; • 40 ≤ b < 60 ; cup deer minute year 1 explode you die... you live! you live! you live and propagate!
By the Way... You’ll Need a Table 1 2 3 4 5 6 7 8 9 10
And Now You Need a Graph... • Cue clever graph thing to fall in... <laugh> • Show real graph and give time for individuals to create and plot.
Let’s Graph It On! Buck Up [Deer vs. Year] 100 90 80 70 60 50 40 30 20 10 Deer 0 1 2 3 4 5 6 7 8 9 10 Years • Before you get all your numbers written in pen, write a large 0 (zero) in the bottom left corner of your graph. Classic Misconception
Growth Rates Buck Up [Deer vs. Year] C Remember... B 100 90 80 70 60 50 40 30 20 10 rise slope = run Deer A D 0 1 2 3 4 5 6 7 8 9 10 Years • What were the average growth rate for segments AB, BC, and CB?
Overshoot & Recover Overshoot & Collapse S-Shape Curve J-Shape Curve Back to Biology • Limiting Factors • Carrying Capacity • Population Graphs
Growth Rates Buck Up [Deer vs. Year] C B 100 90 80 70 60 50 40 30 20 10 Deer A D 0 1 2 3 4 5 6 7 8 9 10 Years • What were the average growth rate for segments AB, BC, and CB? Carrying Capacity ≈ 85 deer Overshoot & Collapse
Questions | Comments | Concerns Buck UP • Population Dynamics and Slope Levi Patrick | K20 Center at OU | 405.325.2720 | lpatrick@ou.edu