Download
1 / 60
600 likes | 825 Views
A Study of Photochemical Processes of Houston Air Quality with EPA’s CMAQ. Daewon W. Byun. Contribution: Dr. G. Lubertino, Dr. S.-B. Kim, Dr. N.-K. Moon, Dr. K. Lazarova Ms. B Czader, Ms. F.-Y. Cheng . University of Houston Air Quality Modeling and Monitoring.

E N D
A Study of Photochemical Processes of Houston Air Quality with EPA’s CMAQ Daewon W. Byun Contribution: Dr. G. Lubertino, Dr. S.-B. Kim, Dr. N.-K. Moon, Dr. K. Lazarova Ms. B Czader, Ms. F.-Y. Cheng University of Houston Air Quality Modeling and Monitoring
Houston Air Quality Characteristics • TexAQS 2000 campaign and historic O3 data analysis have identified massive and frequent spikes of ozone (THOEs:Transient High Ozone Events) • Dependent on the Land/Sea Breeze Circulations • Appear to be associated with large releases of reactive unsaturated hydrocarbons • Models with standard emissions often miss the observed peaks – large uncertainties in VOC emissions
Texas Air Quality Study: Aug./Sept. 2000 0830 12:00 CDT 0830 13:00 CDT Transient High-Ozone Events (THOEs)
Texas Air Quality Study: Aug./Sept. 2000 0830 15:00 CDT 0830 14:00 CDT This picture may not be right Transient High-Ozone Events (THOEs)
Large petrochemical facilities ~50% of USA Capacity
Propylene Emissions CH2=CH2 Ethylene Emissions CH3-CH=CH2
Unsaturated Hydrocarbon Photochemistry • Ethylene reactions CH2=CH2 + • Propylene reactions CH3-CH=CH2 +
Land/Sea Breeze Circulation N N W E W E S S Hourly Resultant Wind Vectors Analysis on (a) exceedance days; (b) non-exceedance days (from Pete Breitenbach, TNRCC)
C408 C1 C607 C608 C408 C1 C608 C607 Application of ARL/UH trajectory model Backward Trajectories for 6 hours ending at C408, C1, C607 and C608 (10m)
Science Issues To Study • How well does MM5 driver run represent the reality? • Do synoptic and land/sea breeze circulations well represented? • Does PBL evolution well captured? • How important is the chemical mechanism in simulating Houston’s high ozone problem? • Does CB-4 represent olefin chemistry well? • How about SAPRC99? • Do we need further enhancement of CB-4 or SAPRC99? • How bad is the VOC emissions uncertainty? • EPA NET96 only; TCEQ 2000 data not for SMOKE/CMAQ • Even the recent inventory may have 3-10 times less olefins
Simulation time: Aug. 22 ~ Sep. 02, 2000, Center (40N, 100W) Domain # of x points # of y points Vertical levels dx (km) dy (km) 1 43 53 43 108 108 2 55 55 43 36 36 3 100 100 43 12 12 4 136 151 43 4 4 TAMU MM5 Simulations (Driver Run) J. Nielsen-Gammon (TAMU)
Name Category 108 and 36 km 12 km 4km 08/22 to 08/26 08/26 to 08/28 08/28 to 09/02 Urban 1 10 10 30 20 20 Dryland 2 30 20 30 20 10 Cropland 5 25 15 25 15 10 Urban Area Temporally modified soil moisture value (%) in TAMU simulation (S2) 25-category (USGS) vegetation categories
PBL Height Evaluation with Wind Profiler Data La Marque (LM) Ellington (EL) Wharton (WH) Liberty (LB) HS (Western Houston)
TexAQS Profiler data August 27, 2000 August 26, 2000 Profiler Profiler MM5-S2 MM5-S2
TexAQS Profiler data August 29, 2000 August 28, 2000 Profiler Profiler MM5-S2 MM5-S2
TexAQS Profiler data August 31, 2000 August 30, 2000 Profiler Profiler MM5-S2 MM5-S2
Impact of Different Mechanism in CMAQ • TEXAQS 2000 (August 22-September 2) • EPA 96 NET • Waiting for EPA NET 99 V2 (IDA Format) • SMOKE Tool/SMOKE emissions processor • TAMU/TNRCC MM5 “driver” base simulation • IC: 2-day initialization runs with emissions data • BC: CMAQ seasonal default at 36-km domain • CMAQ simulations with CB-4 and SAPRC99 mechanisms
VOC emission categories for CB4 & SAPRC SAPRC99 mechanism CB-4 mechanism FORM Formaldehyde ALD2 High molecular weight aldehydes C2O3 Peroxyacyl radical PAN Peroxyacyl nitrate PAR Paraffin carbon bond ROR Secondary organic oxy radical OLE Olefine carbon ETH Ethene TOL Toluene CRES Cresol and higher molecular weight phenols TO2 Toluene-hydroxy radical adduct CRO Methylphenoxy radical OPEN High molecular weight aromatic oxidation ring fragment XYL Xylene MGLY Methylglyoxal ISOP Isoprene XO2 NO-to-NO2 operation XO2N NO-to-nitrate operation
CB-4 and SAPRC Emissions: 96 NET Ethylene Emissions
CB-4 and SAPRC Emissions: 96 NET Olefin Emissions CB-4 SAPRC
CB-4 and SAPRC Emissions: 96 NET CB-4 Aldehyde Emissions SAPRC
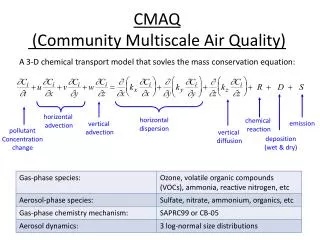
Air Quality Modeling with US EPA’s CMAQ Community Multi-pollutant Multi-scale Air Quality Modeling System
O3 simulations (CB-4 vs. SAPRC99) Process Analysis (Aug 31, 18:00 UTC)
Trajectories: High Ozone Day (Aug 30/31, 21:00 UTC) Propylene
Aug 28 – 31 with NEI96 CB4 SAPRC
Aug 28 – 31 with NEI96 CB4 SAPRC
Aug 28 – 31 with NEI96 SAPRC CB4
Aug 28 – 31 with NEI96 SAPRC CB4
CMAQ, 96NET-SMOKE, CB-4 vs. SAPRC99 CB-4 SAPRC99
O3 simulations (CB-4 vs. SAPRC99) and Process Analysis (Aug 31, 21:00 UTC)
Max. O3 Difference between SAPRC99 and CB4 Mechanism: Aug 23 – Sept. 1, 2000
Impact of Emissions Uncertainty • Use of TCEQ’s most recent CAMx-ready emissions data • EPA 96 NET (current UH database) too old • Projection possible, but less reliable • Waiting for QA’ed EPA 99 NET IDA format data • Current UH emissions processor is SMOKE Tool/SMOKE • Has not fully learned TCEQ’s emissions processing steps with EPS2 yet. • Compare with the NET96 CMAQ runs • “very large” emissions sensitivity (from 96NEI to current TNRCC) • Help evaluating robustness of meteorological data • Evaluate with observation data • Help performance comparison with CAMx simulations
Benefits of using CAMx-ready data • TCEQ has invested many emissions processing components: Major differences from EPA NET 96/99 • Mobile • (on-road/off-road, commercial marine, aircraft, railroads, etc) • Biogenics: GLOBEIS • Satellite derived radiation and surface temperature • Landuse data & Land cover categories • Point sources • More recent, better QA’ed data • More time dependent information (upsets, etc) • Speciated VOC (Ship Channel point sources)
Limitations of relying on CAMx-ready data Emissions • Only for CB-4 mechanism available now • Subject to data availability • Impossible to make additional data linkage between emissions, met data, and/or model configurations • Difficult to characterize CMAQ model performance in relation to each emissions component with mixing, transport, and chemical mechanism. • Limited emissions control sensitivity runs possible
Emissions Data Processing I/O converter netCDF Area Data CAMx Area Data Species renaming Unit conversion Coordinate conversion Major stack camxPt Major emis CAMx Point Data MEPSE stack Unit conversion Species renaming Coordinate conversion MEPSE emis
Emissions-Chemistry Interface Processor netCDF Area Data MCIP Output Major stack Major emis ECIP CMAQ Emissions Data MEPSE stack MEPSE emis Unit conversion Merging Plume Rise Plume Dynamics Model (if MEPSE used)
Sample Comparison of Emissions: August 30, 2000 CAMx-emissions EPA NET 96
Sample Comparison of NOx Emissions: Aug 30 CAMx-emissions EPA NEI 96
Sample Comparison of NOx Emissions: Aug 30 CAMx-emissions EPA NEI 96